After the Pullback, These Stocks Are Primed for Upside Gains!
The stock market just experienced its first decent pullback since mid-October, as the major indexes saw steep declines last week.
The key question now is if this pullback is a good opportunity for investors to buy the dip.
While it’s too soon to say for sure, I do like the way both the S&P 500 and Nasdaq 100 both bounced strongly off their 50-day moving averages last Friday:
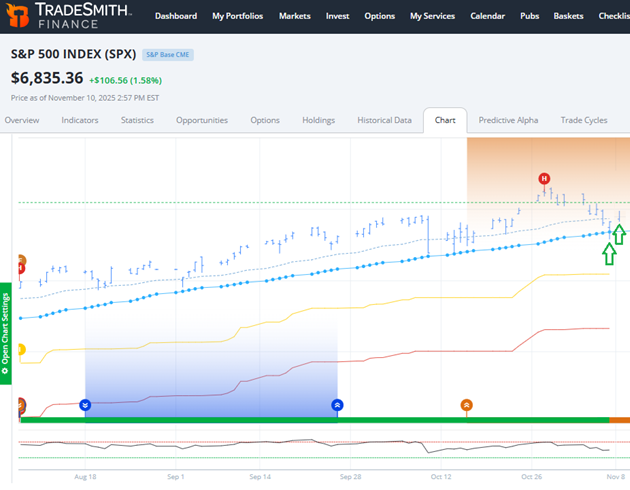
Friday afternoon’s strong upside reversal, and yesterday’s follow-through higher, are both good signs that traders are willing to buy this dip. And they did so enthusiastically.
If that’s the case, TradeSmith readers have an AI-powered secret trading weapon on their hands.
This tool can help identify the best stocks primed for short-term gains as markets recover from here.
And it’s not a hard opportunity to find, either: You can get started on your hunt for quick-hit winners simply by consulting TradeSmith’s Predictive Alpha AI trading algorithm.
Our Predictive Alpha system gives you real-time price projections for thousands of individual stocks, funds, and ETFs, projecting as far as 21 days from now. And as it looks forward, Predictive Alpha can provide you with precise price forecasts – telling you right down to the penny where it expects a given asset will move.
If you’re a member of Predictive Alpha Prime TradeSmith Platinum, simply log into the TradeSmith Finance platformto get started with these powerful tools.
From your Dashboard (or home page), scroll down to the Predictive Alpha widget. Then, click the “Top Bullish” tab. You’ll find a convenient list of our 10 best stock price projections for the next 21 trading days, as shown below:
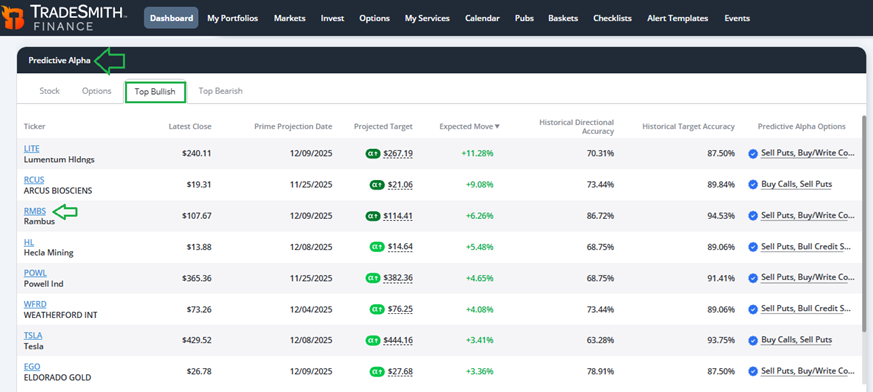
You can click on any of the symbols in this list to go directly to the Asset Details page for that stock – and you can select the “Top Bearish” tab to view the stocks that Predictive Alpha sees taking a downturn, too.
Our Predictive Alpha software uses two different types of AI models working in tandem to calculate its projections – in what’s known as an ensemble model – with the potential to deliver accurate stock price forecasts up to 21 days into the future…
The first of our system’s AI models focuses on the bigger picture moves a stock could make. And it projects the stock’s expected price trend by analyzing longer-term factors.
The second model, on the other hand, takes a closer look at day-to-day price action. It looks at short-term trend changes and takes market volatility into account – all to help us pick up on shorter-term price moves and risks.
By combining both models, Predictive Alpha has the power to give you a historically accurate view of current price trends… and most importantly, insight into where the latest trend is likely to lead prices next.
These forecasts have helped make Predictive Alpha one of the crown jewels of TradeSmith’s market analysis tools. But as powerful as it is, we’re always making improvements: While our model still shows price forecasts for 21 trading days out, we’ve also added the ability to make price projections for each day in that 21-day range.
In other words, subscribers with access to Predictive Alpha now have access to 21 individual projections on each stock in our database. And that’s not all: The Predictive Alpha model will also identify the most accurate price projection within that 21-day forecast window.
We call it the “Prime Projection Date.”
Let’s take a look at an example by clicking on Rambus (RMBS) from the list above.
That will take you to the Asset Details page for RMBS. Next, simply click on the Predictive Alpha tab at right to find the stock’s latest 21-day price forecast:
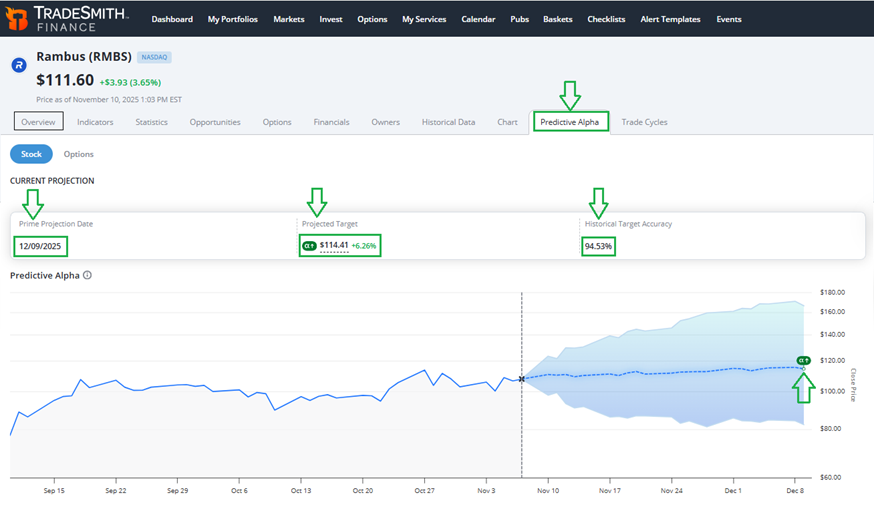
Here you’ll find all the key data for RMBS, including the…
- Prime Projection Date: the date of our most accurate projection for the stock
- Projected Target: the exact price target projection
- Expected Move: the percentage gain to reach that projection
- Historical Target Accuracy: the historical accuracy of our price targets for the stock
- Projected Range: the shaded area that gives you a visual of the likely high-to-low price range for the stock
And by hovering over the blue shaded projection line, you can see the daily price forecasts for the next 21 days as determined by our system.
In the case of RMBSabove, Predictive Alpha expects the stock to reach a target price of $114.41 by Dec. 9, 2025 – 21 days from now (at the time this column was written).
That represents a +6.26% move from the current price – and when it comes to RMBS, our price projections have a historical target accuracy of 94.53%. That sounds good to me!
That said, you don’t need to limit yourself to viewing just the Top Bullish (or Top Bearish) projections from Predictive Alpha’s powerful database.
From any page on the TradeSmith Finance platform, simply click on the Search for Ticker box at the upper right, and type in the ticker symbol for any stock to pull up its Asset Details page – where you’ll find the Predictive Alpha data, just as we did with RMBS.
Let’s take a closer look at AI chip designer Nvidia (NVDA), for instance:
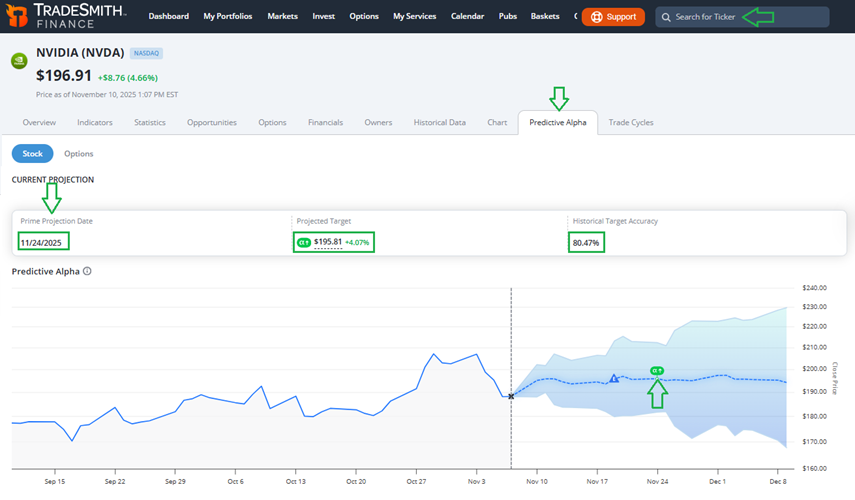
In this case, our Predictive Alpha software expects NVDA to reach a projected target price of $195.81 by Nov. 24, 2025 – that’s just 11 days from now.
That would represent a +4.07% move from the current price, and given that our target projections for NVDA have a target accuracy of 80.47% historically… Well, I’ll be keeping an eye on NVDA over the next week and a half to see what happens!
Just from these examples, you can see the awesome edge traders and investors can get by using our Predictive Alpha tools.
Having the ability to determine the projected price trend for thousands of stocks before you consider buying can make all the difference in positioning your portfolio… or profiting from short-term moves before they slip away.
That said, there’s another way to leverage this powerful software that I’m always fond of… and that’s by using Predictive Alpha in tandem with our trusty TradeSmith Screener tool.
We can find a list of Predictive Alpha Bullish or Bearish stock projections tailored to our investment preferences by simply choosing a few easy-to-use Predictive Alpha screener filters. To get started, simply click on the Invest tab from the main TradeSmith Finance menu, then from the sub-menu, click on Screener.
Now you’re ready to add your filters.
To do so, simply click the blue +Add Filter button to tailor the Screener to your tastes. Here, you’ll find all kinds of filters for TradeSmith’s Proprietary Metrics, like our Health Grade and Volatility Quotient (VQ%), to market filters, Price & Volume factors, Valuation & Fundamental metrics, and much more:
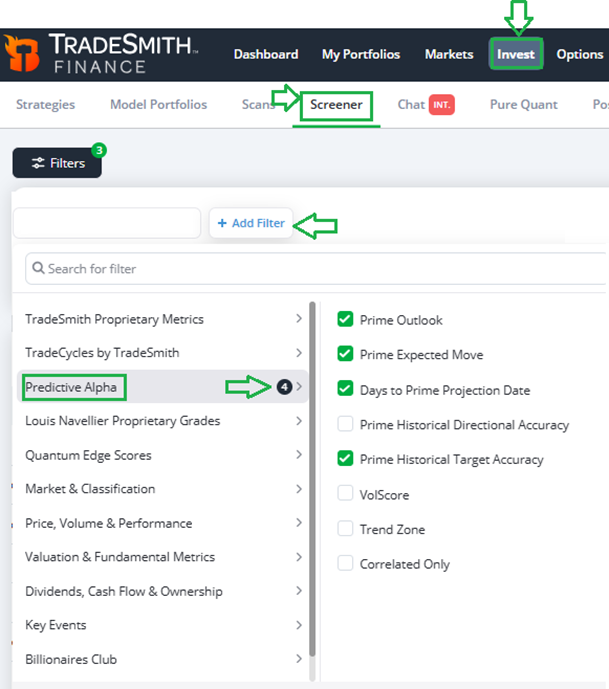
But today, let’s stay focused on our powerful, AI-enabled Predictive Alpha filters. Simply click on the Predictive Alpha category header shown above, then click to check the boxes for the filters you’d like to use.
Here are the settings I used for my latest Predictive Alpha Screener:
- Prime Outlook, filtering for Bullish and Very Bullish…
- Prime Expected Move, set to more than 5%…
- And Prime Historical Target Accuracy, set to more than 70%.
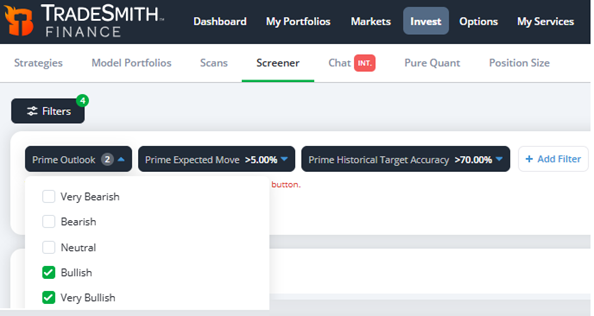
These settings will search our Predictive Alpha database only for stocks expected to move higher (Bullish and Very Bullish Outlook), and that are projected to move up 5% or more, with a historical accuracy of 70% or better – all over the next 21 days or less!
Mike Burnick’s Bottom Line: Following the recent market pullback, you can take full advantage of our Predictive Alpha strategies to peer into the future to find detailed, real-time stock price projections, right down to the penny, over the next 21 trading days.
But that’s not all I have to say about this powerful system. Soon in Inside TradeSmith, I’ll show you exactly how to leverage the Predictive Alpha tools to unlock the leveraged profit potential of options – all backed by our AI-enabled projections. Stay tuned.
Good investing,
Mike Burnick
Senior Analyst, TradeSmith
P.S. Predictive Alpha is one of the most powerful tools in the TradeSmith arsenal – and its ability to forecast the future of stock movements is an incredible asset when it comes to planning your trades in the short term.
But even as the market recovers from its recent pullback, and flashes short-term bullish signals… things might not be quite so bullish under the hood.
Right now, a historic warning alert is firing across Wall Street – the same type of pattern recognized by one TradeSmith analyst before several of the most devastating market crashes in history.
Jeff Clark calls it “The Breaking Point.”
It’s the same setup that appeared before the 1987 crash, the Dotcom bust, the 2008 meltdown, and the 2022 tech collapse that sent Palantir plunging 55% in just 37 days.
Now, Jeff’s spotted this signal again – on Apple, Tesla, and more than 60 other S&P 500 stocks.
It could turn a potential crash into one of the biggest wealth-building opportunities in years. And he’s sounding the alarm to get as many people ready as possible.
Earlier this week, Jeff revealed how his private “anti-bubble” strategy helped followers sidestep losses… and even capture triple-digit gains during past market chaos. He’s making this info available to the public now – to help you prepare for the moves to come.
Click here to get the details from Jeff now – and learn how to get ready.