April 28, 2026: Interview with Lucas Downey (full transcript)
Click HERE to return to the full Inside TradeSmith Issue.
Mike Burnick, Inside TradeSmith: Hello, everyone. I’m Mike Burnick for Inside TradeSmith, and with me today is a very special guest, Mr. Lucas Downey, our TradeSmith analyst and a friend of mine.
Hey, Lucas. How you doing today?
Lucas Downey, Senior Analyst, Signals by TradeSmith: Hey, Mike. Great to see you.
Mike: Good. We’re getting together right now not only to talk shop about the market, which I love to do with all the analysts here at TradeSmith, but also we just launched an all new — and really the most powerful, I think – trading tool that TradeSmith has ever put together.
That, of course, is the new Signals by TradeSmith, which just launched this week. You’re the man of the hour, since you’re the analyst in charge of making sure everything goes smoothly with Signals. I wanted to have you on just to chat a little bit about it.
It’s interesting with Signals. Basically, the idea behind it is that there are these hidden patterns in the market that it just takes a little brain power — or computing power these days — to uncover and profit from.
It reminds me of that old book, I’m sure you’ve read it, Lucas – A Random Walk Down Wall Street. You remember that book?
Lucas: Yes.
Mike: That was a huge hit back in the 1970s and ’80s.
I was just getting into the business in the ’80s. I read it, and of course it makes the argument that you can’t beat the market — that everything is completely random, the way stocks move.
I thought at the time, in the early ’80s, that that was just a bunch of baloney, and I still do. Guys like Jim Simons at the Medallion Fund have proved it. His hedge fund returned 66% per year, exploiting just these kinds of hidden patterns for 25 straight years during the ’80s and ’90s.
So it can be done, and Signals by TradeSmith is our version of how to find these hidden patterns to profit from. So go ahead and tell us a little bit about Signals, how it came about, and your involvement in it?
Lucas: So we launched what I would call the prototype, which is Alpha Signals, a little over a year ago.
Behind the scenes, TradeSmith had some software that wasn’t quite ready for consumers to use, but I could go in and look for these anomalies. That’s really what a signal is – something that happens that’s relatively rare. Say that the S&P 500 goes up seven days in a row, or ExxonMobil gets an RSI of 25. These kinds of extreme events. You hear about them all the time on the news. They tell you, “Hey, this is just happening.”
But what they fail to tell you is what happened last time that occurred – stocks did X.
So we were able to do this prototype with Alpha Signals for over a year, and we had great success finding these trade setups.
The whole idea was: there are these anomalies, these signals that happen. We look back, find out how rare they are, and then determine what happens next. Is there an expected move that tends to follow?
In some of these cases, you’d see a 90% rate that stocks blast higher after these anomalies. We would roll these trades out to platinum subscribers at the time, and we had quite a few winners. It wasn’t perfect, but it certainly blew me away — the way that you can look at the market through this lens.
Now, Alpha Signals is definitely discretionary. I was going in and hand-picking setups. You don’t necessarily know when a signal is going to come up – it could be one a week, it could take a month for the next one, or you might get three in a stretch.
What we decided to do was build a full software platform and make it really powerful. It’s fully automated — there’s no discretionary element to it. It looks at over 170 different anomalies that are short-term in nature.
Imagine a stock has an extreme RSI, and through machine learning we find that after it falls two days following that reading, it tends to bounce. These are patterns you can’t detect with the human eye. When you’re doing this hundreds of times across thousands of stocks, you’re able to generate all of these signals each day.
On top of that, we built in a quality score that looks not only at signals with a high accuracy rate, but also measures the stocks and the environment they’re in today, then looks back to see what happened in similar environments.
It really tries to give a more predictive forward outlook. Very powerful stuff. And even this morning, through the alert system — you can go into the software and ring the bell, so to speak, to be notified when a trade triggers its sell condition– I had a couple of those come through. That was really cool to see.
Mike: That’s all automated too. That’s the beauty of it. You get the alerts and you could be sipping your morning coffee, and you’ve already made 500 bucks — time to cash out.
Lucas: Exactly.
Mike: I think it’s fascinating. When we launched Signals – originally to our platinum members to beta test it – the results were fantastic. The system runs through almost 200 different possible entry rules and dozens of exit rules.
When these anomalies happen, when these certain patterns line up just right in certain stocks, historically it’s led to these consistent moves, either up or down, and of course we’re trying to take advantage of that.
By the way, Lucas just did a major video briefing, and there’s a link to it right at the bottom of this page. I want to let all of our TradeSmith Insider viewers know they can click that link after this video is over to learn more from Lucas about Signals.
But tell us what type of trades we’re normally looking at here. Is it more of a day trading situation, or is it more of an average holding period of several weeks to even a month or more?
What can we expect from the different signals?
Lucas: Great question.
This is definitely a shorter-term signal system. The longest a signal could ever run is one month, or 21 trading days.
Everything is on a shorter timeframe. Your typical trades are going to be anywhere from 5 to maybe 15 days. You can see all of that with each signal and each stock you’re looking at.
The beauty is that you already have the exit predefined before you do the trade. There’s typically a 4% expected gain target – once the stock reaches 4% from your entry, that triggers a close the next day.
In the event that doesn’t occur, you simply close the trade on the 21st trading day, basically a month. Very simple. This is fully automated. It runs itself, so there’s a lot less babysitting involved.
Mike: Yeah, it sounds very streamlined and straightforward because it is more of a mechanical system.
A trade window of anywhere from five days to 20 days — that’s not day trading where you’re only trying to scalp a point or two. You’re looking at more of a swing trading environment where a stock may move up over a period of two or three weeks.
Lucas: Yes.
Some of the common signals we look for we call sprints, which is very much the trend-following approach you’re describing – if a stock just continues to go up, historically that might mean it’s going to keep going up.
One of my favorite setups is what we call a pivot trade, and that’s typically a stock that’s in a big uptrend, pulls back slightly, and we believe it’s going to bounce back to its primary uptrend.
There are also sequence trades, which are calendar-related. And there’s volume expansion and volume contraction – if a stock has been really quiet for a while, it tends to make an explosive move very soon. It’s like a coiled spring.
We’re really looking at all types of different market environments. Markets trend sometimes; sometimes it’s a reversion-type trade. This is really jam-packed, and I’m very excited about it.
Mike: I’d like to share our screen here a little bit. This is a view of the Signals page on TradeSmith Finance. Subscribers just go to the main menu on TradeSmith Finance — the main dashboard menu at the far left — and a couple of ticks over is Signals. Every single trading day, Lucas, we put out a list of the top 20 signals, right?
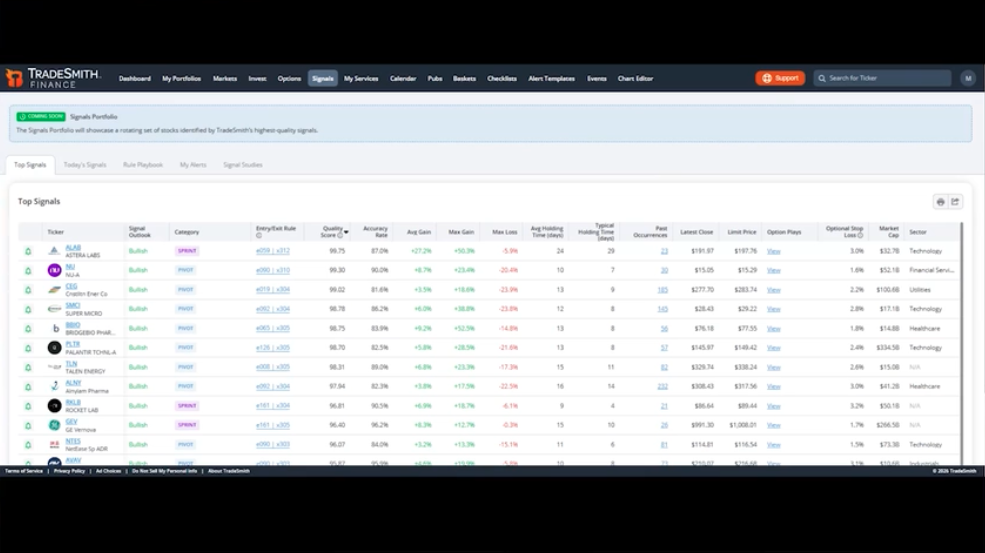
Lucas: Top 20, that’s right.
Mike: And if that’s not enough profit opportunities for one day, you can click on Today’s Signals and get the full list. There are also filters you can open up and use with other favorite TradeSmith indicators – things like Business Quality Score or Market Cap.
You can see there are a lot of different signals across various categories for a lot of popular stocks. These are mostly S&P 500 stocks, aren’t they, Lucas?
Lucas: We started out with the S&P 500 and have expanded from there, but on the selection criteria you’re looking at large caps and mid-caps, so a lot of those are going to be represented in the S&P 500.
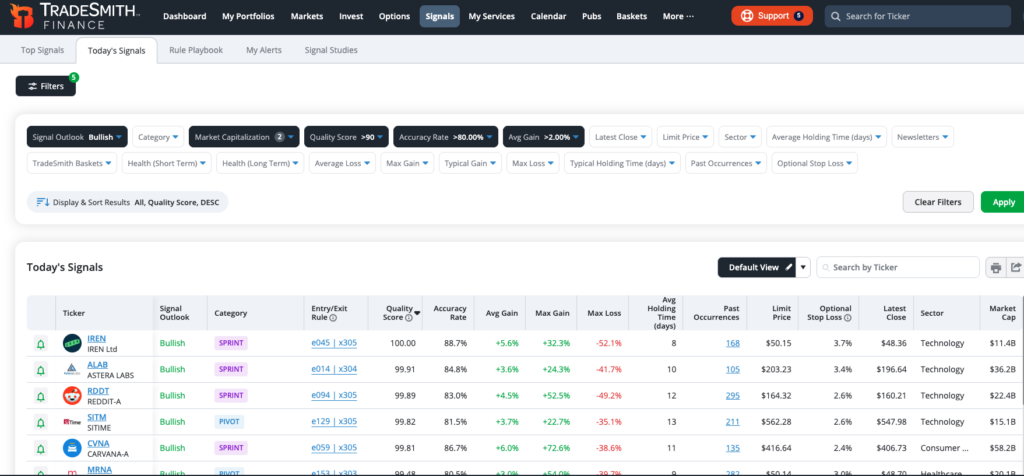
Mike: Right. And you can see the different categories, there’s a sprint trade, which is trend-following and momentum.
Here’s your favorite, Lucas — a pivot trade on AppLovin, where the stock pulled back a little bit, recharged its energy, and you get a chance to buy it on the cheap.
The columns are mostly self-explanatory. The key is the quality score you mentioned. This one for Irene, for example, is a perfect 100 quality score.
We also have the accuracy rate of past signals trades for each particular stock, you can see the accuracy here is all in the 80% range for these top ones. And the next column shows the average gain and the typical max gain. For Irene, it was 32%, which is pretty good.
Subscribers to Signals and TradeSmith Platinum members can access this right away by going to the main menu and clicking the Signals tab. There’s also a tutorial that we put together — you actually put that together, didn’t you, Lucas?
A full presentation that goes into much more detail on Signals. You can access that by clicking the link at the bottom of this page.
One more question: what type of trader or investor would you say Signals would most appeal to? Or could it appeal to a lot of different folks?
Lucas: Great question.
Swing traders right off the bat, because if you can take advantage of some of these big moves – and we’re seeing them every single day, the NASDAQ is up like 12 days in a row or something, if you can ride stocks up, hop off, and do it again, that’s really exciting in markets like this.
This is definitely going to be good for day traders and swing traders. But even people sitting on a broader portfolio who want to look at stocks that haven’t done much in a while, or that are up or down significantly, can come in here and see if there are any quality signals for their holdings and help navigate which way they want to lean. There’s a lot here for everyone.
I also want to point out that we’re continuing to add to and invest in this software. There are going to be so many more bells and whistles.
What you just showed is really just the front end of what’s available with Signals. There are a lot of charts where you can see the historical trends of a stock for a given signal, and you can look at all prior signals to feel comfortable and confident in what we’ve built.
Mike: Absolutely. For a much deeper dive, be sure to check out Lucas’s tutorial video, the link is at the bottom of this page. And Lucas, for folks who like a lot of action — you also have option plays on many of these stocks, also delivered on the Signals page, right?
Lucas: That’s right. It’s very straightforward, you’ll see call spreads and put spreads. Just as stocks have 21 trading days as a window, options follow that as well. We’re looking for at least 28 days until expiration. We also covered how to trade those in that series we filmed.
Mike: That’s great. So for folks looking for shorter-term, leveraged profit opportunities, we’ve got that available too with Signals. Well, Lucas, thanks so much for joining me today.
I really enjoy talking with you, and especially about this new Signals product, which I think is the biggest breakthrough we’ve had here at TradeSmith in a long time.
Thanks for filling us in on all the bells and whistles.
Lucas: Thanks for having me. It’s always great to chat with you, let’s do this more often.
Mike: You bet. We’ll have to do it again soon.
And folks, there’s a link right at the bottom of this page to a special video presentation that Lucas put together with some of our other TradeSmith colleagues.
You can access that to learn more about Signals by TradeSmith. Until then, this is Mike Burnick for Inside TradeSmith. Good investing, and thanks for joining.