Buy The Dip Right With These Top Market Performers
Last week, I pointed out how the stock market’s recent slip on the ice didn’t do much damage… at least outside of the Technology sector.
Though tech stocks certainly took some headline beatings to close out January, most of the S&P 500’s component sectors and stocks still look quite healthy.
Which, by my money, leads us to a potential opportunity to buy the dip.
As if to reinforce this idea, last week ended on a high note – for both the overall stock market as well as the Technology sector.
Last Friday in particular saw a broad-based surge in advancing over declining stocks. And in fact, it was nearly an 80% upside day for the S&P 500: Eight out of ten stocks rose that day, with 80% of the volume on the upside.
This was also accompanied by a noteworthy expansion in the number of stocks making new highs: Both the S&P 500 and the broader New York Stock Exchange experienced the biggest jump in stocks trading at new one-year highs vs. lows in over a year!
And that upside expansion in stock market breadth on the rebound just strengthens the case for buying the dip.
That said, even with the number of advancing stocks surging higher, not all stocks are equal: Some of the biggest stocks on the market could see further downside before turning things around.
Instead of waiting for these stocks to turn the corner, you can turn the market’s good breadth to your advantage right now.
And in today’s issue of Inside TradeSmith, I’ll show you how – by using TradeSmith’s Performance Leaders analytics to spot the elite stocks that are making new highs.
Coming Soon: Your Next Inside TradeSmith Quarterly Webinar
On Friday, Feb. 20, the TradeSmith Product Education Team and I will host your next Inside TradeSmith live webinar, featuring an in-depth look at the seasonality statistics offered as part of our Trade Cycles software.
Designed to help investors identify high-probability trading windows across individual stocks and major markets, these seasonality statistics can help you identify the best month, week, and even calendar date to buy and sell any stock.
In this session, starting at 1:00 p.m. Eastern Time, our team will teach you how to get started with these powerful tools – and give you everything you need to make the most of the wealth of data Trade Cycles offers.
You can click HERE to register for the webinar on Friday, Feb. 20.
With that said, let’s get back to the Performance Leaders.
Find Market Winners And Losers With TradeSmith Analytics!
To access the latest performance data, simply log in to your TradeSmith Finance Dashboard. Click on the Markets option from the main menu, then select the Performance Leaders tab in the sub menu, as shown below:
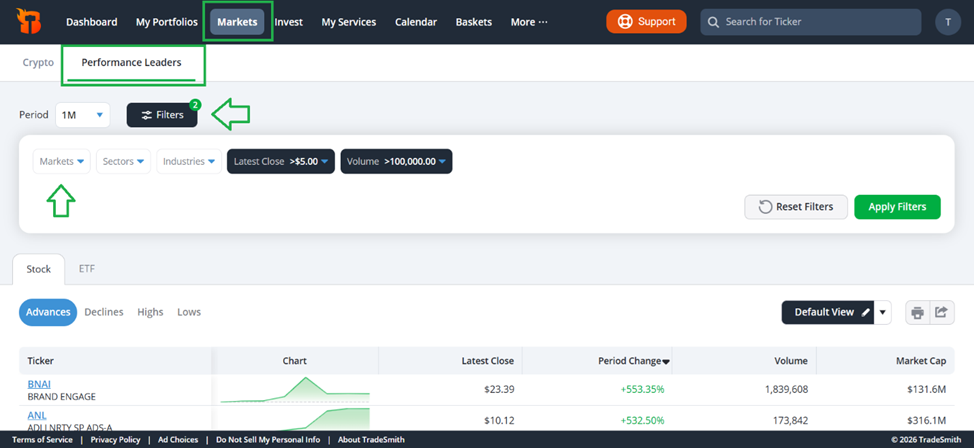
From this page, you can use multiple filters to find the market’s latest winners and losers over various time frames, across both stocks and ETFs.
You can look at stock performances today, or review up to 5 years of performance, all with the click of a button:
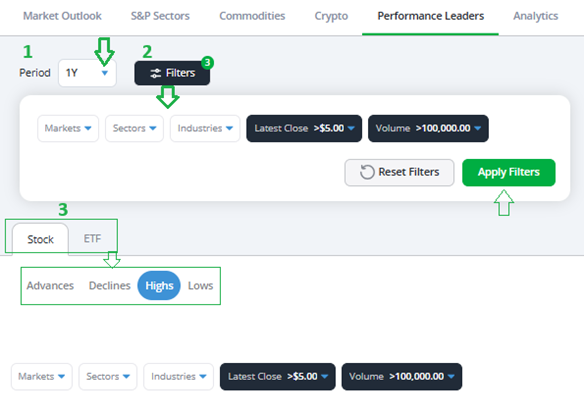
It’s as easy as 1, 2, 3…
First, set your time frame for reviewing performance by clicking the Period drop-down menu. You can view performances as of today, or review up to 5 years of market performance depending on your preferences.
Second, you can filter your results by:
- Markets, such as the S&P 500 or Russell 2000…
- Sectors, including Technology, Energy, and Healthcare…
- Industries, like Software or Oil & Gas…
- Or review results based on Price and Volume.
Third, you can choose between stocks and ETFs and select a condition from Advances, Declines, Highs, or Lows. That will display a list of assets over the time frame and condition you select.
To illustrate this with an example, let’s say I want to view Stocks in the S&P 500 Index (With prices above $5/share and with a trading volume of more than $100,000 day) that are trading at one-year (1Y) highs.
There were 100 results when I ran this performance leaders list recently, by quickly swapping out a few of the filter settings as shown below:
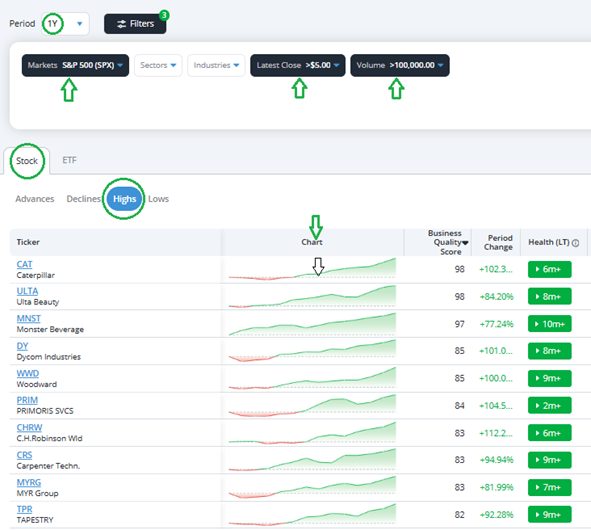
The top 10 are shown above, sorted by the stock’s Business Quality Score (higher is better). These are stocks that are performing well despite the market’s earlier dip… and if I was looking to buy the dip, these are the stocks I’d start my research with.
Mike Burnick’s Bottom Line: Our Performance Leaders data can help you find stocks that are potential buy the dip candidates, but that’s not all this data can reveal.
You can change the filters on this page to find stocks on the new lows list that may be oversold and ready to rebound. Any way you slice it, whether you’re a deep value investor or just looking for a quick trade, TradeSmith’s analytics can provide you with a well-informed edge.
Good investing,
Mike Burnick
Senior Analyst, TradeSmith
P.S. TradeSmith’s Performance Leaders data can give you an edge when looking for your next trade, especially if you’re eager to buy the dip. But if you’re looking to trade options, knowing which stock to trade is only one half of the equation.
The option contract you select can make or break your trade, regardless of how the underlying stock moves. Without the right expiration date, you may find yourself too early to act… and without the right strike price, you could end up losing money on the trade even if your trade thesis is spot on.
That’s where TradeSmith’s Fair Value Options tool comes in. One of our newest developments, the Fair Value tool enables you to spot mispriced opportunities in the options market.
It’s a great tool to have when picking your next options trade, and it’s already become one of my favorite market-scanning tools in the TradeSmith arsenal.
But what you may not realize is just how powerful this tool really is.
That’s why TradeSmith CEO Keith Kaplan has pulled back the curtain in his T-Day Summit, to show off all that this technology can do. By identifying price inefficiencies in the options market, the Fair Value tool has pinpointed trades capable of delivering 113% gains in one hour… 172% in four hours… even 600% in just one hour.
It’s no exaggeration to say this could be the start of a new era in trading – much like the birth of options trading in 1973 or the first ETF in 1990.
If you don’t have access to this powerful tool yet, don’t wait.
Watch Keith’s T-Day Summit webinar now, and see the fair value tool in action.