Discover Stocks with Upside Potential Using Our Earnings Countdown Calendar
Quarterly earnings reporting season is winding down, but there are still a few S&P 500 companies left to report this week – including several retailers, like wholesale giant Costco (COST).
At the forefront of recent earnings news is NVIDIA Corp. (NVDA) – the leading gunslinger among the “Magnificent 7” band of mega-cap tech stocks. NVDA released its fourth-quarter earnings report last week… but its results didn’t impress.
As a bellwether for the stock market as a whole – and the clear leader of the AI trade fueling market performance in recent years – NVDA’s results are closely scrutinized. And last week’s “good, but not good enough” results have contributed to the market’s recent weakness.
As you can see below, NVDA has beaten earnings per share (EPS) estimates for the past two quarters in a row. And the company exceeded estimates again last week – for both top-line sales and bottom-line EPS.
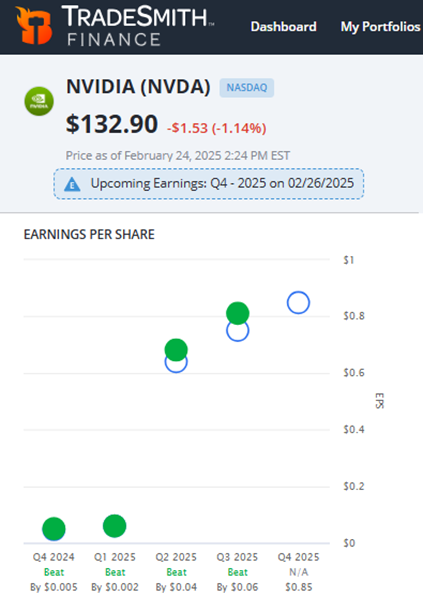
However, stocks like NVDA are judged not just by their actual results, but by how much they beat expectations – as well as by how bullish their EPS guidance and full-year performance predictions look for the next few quarters.
That’s where NVDA fell short. But, downside pressure on the stock since last week could result in a big rebound rally… at some point.
And that’s where TradeSmith’s exclusive Kinetic VQ strategy comes in handy. It’s well suited for alerting you to stocks that could make big post-earnings price moves.
In today’s column, I’ll take you on a guided tour of how to use this powerful strategy during earnings season.
But first, let me give you the backstory on the strategy.
How Kinetic VQ Works
Kinetic VQ identifies healthy stocks that have a higher-than-usual Volatility Quotient (“VQ”). This extra volatility acts like stored-up “kinetic energy,” like a coiled spring. As soon as that kinetic energy gets released, the stock price can move significantly.
And that’s exactly what happens to many stocks during earnings season, especially high-profile stocks like NVDA.
Before earnings announcements, traders and investors are often reluctant to buy into a stock, resulting in the stock trading in a narrow price range – like a proverbial spring getting compressed.
Then once the earnings results are posted, all that stored energy can get released, leading to a big price move up or down.
When a stock’s current VQ is above its historical average, it acts as additional energy that can propel the stock as the VQ gradually returns to its normal levels – and that additional energy is what the Kinetic VQ indicator tracks.
For a stock to generate its own kinetic energy, and be included in Kinetic VQ strategy, it needs to meet four criteria…
- The historical average VQ must be less than 40%…
- Current VQ must be at least 20% higher than the average…
- The stock must be in the Health Indicator Green…
- And finally, the stock must trade at least 100,000 shares or more.
NOTE: Premium and Lifetime members of Ideas by TradeSmith, as well Trade360, TradeSmith Essentials, or TradeSmith Platinum members, have full access to all our TradeSmith Ideas Lab strategies and tools, including Kinetic VQ. If you don’t see them in your TradeSmith Finance dashboard — but would like to — simply call us at 888-623-0858 to discuss.
When a stock’s current VQ is above its historical average, The Kinetic VQ strategy is one of our TradeSmith Ideas Lab strategies, featured in our Ideas by TradeSmith subscription.
If you’d like to learn more about how the Ideas Lab strategies and tools can enhance your investing, you’ll want to tune in to your next session of TradeSmith Bootcamp.
Your Next TradeSmith Bootcamp Webinar: Getting Started with Ideas by TradeSmith
On Tuesday, March 18, TradeSmith Product Education Specialist Kristin Magenst will host your next TradeSmith Bootcamp, featuring an in-depth look at the features of Ideas by TradeSmith.
Designed to help investors discover high-quality trade ideas based on data-driven insights, these tools and features can help you explore pre-screened investment opportunities, customize filters to match your strategy, and integrate trade ideas with other TradeSmith tools for smarter decision-making.
In this session, starting at 1:00 p.m. Eastern Time, Kristin will teach you how to get started with these powerful tools – and give you everything you need to take your investing to the next level, whether you’re new to the TradeSmith Finance platform or just looking to refine your investment approach.
You can click HERE to register for the webinar on Tuesday, March 18.
With that said, let’s take a look at how you can find new opportunities with the Kinetic VQ strategy – with a simple but powerful TradeSmith Screener.
Screening for Potential with the Kinetic VQ
To find stocks that meet our Kinetic VQ strategy, simply log in to TradeSmith Finance and select Invest on the top menu bar. Then, click Opportunities from the sub menu.
Next, open the Strategies dropdown menu and scroll down to Ideas Lab, then select Kinetic VQ. This will give you the top 20 stocks that qualify for this strategy.
You can also access the Kinetic VQ strategy using our TradeSmith Screener. And here’s where earnings reporting season comes into play: One of our many screener filters is Days to Earnings – which acts as a countdown-calendar for upcoming earnings reports.
How to Set Up a Screener for Kinetic VQ
Here’s how to set up your own Kinetic VQ screener:
From your TradeSmith Finance dashboard, simply click on Invest at the top of the screen, then select the Screener tab and select the green button labeled + Create new screener.
Now you can click + Manage Filters to build a simple stock screen including our Kinetic VQ strategy filter.
To screen for stocks with upcoming earnings announcements, simply add the filter Days to
Earnings, found under the General filters.
You can also select as many other filters as you like to customize your screen further.
Below is a screenshot showing how I set up this easy screener for myself:
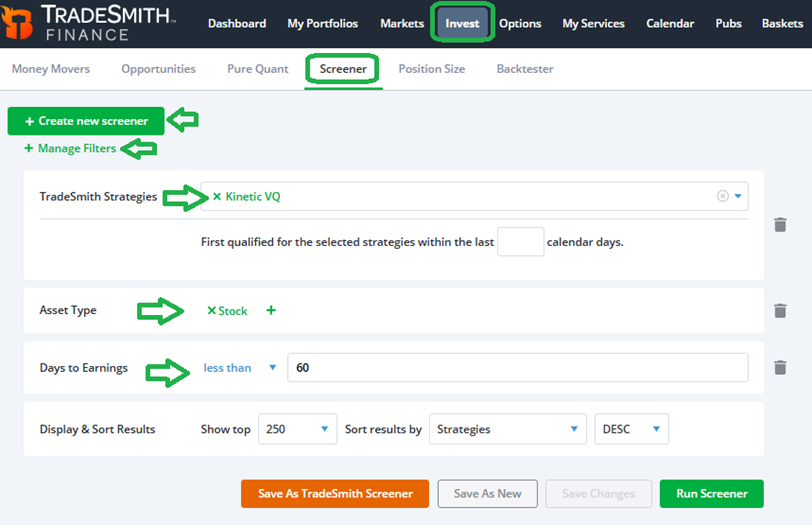
To qualify for the Kinetic VQ strategy, the stocks must already be in the Health Indicator Green or Yellow Zones, so no need to add specific filters for those.
For the Days to Earnings filter, I chose less than 60 days, but you can narrow the time frame based on your preference to say – 30 days, or expanding it to 90 days, for example.
You could also consider adding more quantitative filters if you wish. These could include Business Quality Score (BQS), Cycle Turn Area, Seasonality, or any of the numerous other TradeSmith filters that are available to you, depending on your subscription.
But for this screen, let’s keep it super simple. Be sure to click on Save As New to save your work for later. That way, you can experiment with adding or removing extra filters – while keeping the option to always return to your basic Screener.
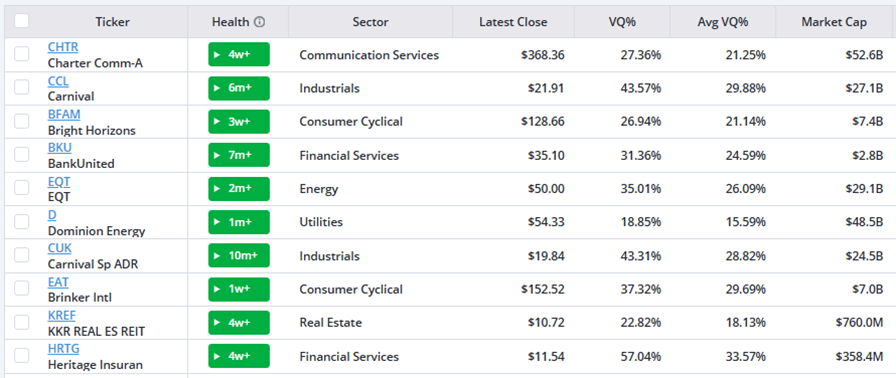
Now, click on Run Screener to see the results. When I ran this screener yesterday, it gave me 29 results, with the top 10 shown below:
Mike Burnick’s Bottom Line: Earnings season can be a great opportunity to go prospecting for new investment ideas. And our TradeSmith Kinetic VQ strategy, combined with the earnings countdown calendar filter, can be a great place to start your search.
Good investing,
Mike Burnick
Senior Analyst, TradeSmith
P.S. TradeSmith’s Kinetic VQ strategy can help you capitalize on market volatility by finding stocks primed to move. But that’s not the only TradeSmith development you can use to time your trades: The Trade Cycles Seasonality tool can add an extra layer of precision on top of the Kinetic VQ strategy.
The Seasonality tool leverages decades of historical market data to identify both bullish and bearish periods for over 5,000 stocks. And earlier this year, TradeSmith CEO Keith Kaplan introduced Seasonal Edge — a powerful new trading system built from this seasonality-scanning system.
Seasonal Edge scans the market for the strongest bullish seasonal periods each year – and delivers real-time notifications straight to your inbox, to help you trade each one as it opens.
In backtesting, this “Green Day” strategy achieved an impressive 83% accuracy rate over 18 years, suggesting a $10,000 investment could have grown to $85,700… outperforming the S&P 500 by 99%.
If you missed Keith’s Breakthrough 2025 event where he unveiled this groundbreaking system, don’t worry — you can still catch the replay. And with seasonality indicators flashing green for dozens of stocks, now is the perfect time to learn more about our latest triumph.
Click here to access Keith’s presentation – and learn how you can harness the power of seasonality.