Financial Stocks Are Flashing A Warning Sign We Haven’t Seen Since 2008
$11.8 billion dollars.
That’s how much investor money has flowed out of financial stocks so far this year, according to data from Bank of America (formerly Merrill Lynch) – and that’s from just one brokerage firm.
According to ETF.com, the S&P Financial Sector ETF (XLF) alone has suffered cumulative outflows of nearly $2 billion year-to-date – and that’s just one of many financial sector ETFs.
It’s no wonder that the worst-performing sector so far this year (by far) is financials stocks, down 8.6%.
That may be a surprise to many investors, considering all the scary headlines about tech stocks getting crushed. But financial stocks in the S&P 500 have fallen nearly three times more than tech, which is down just 2.9% year-to-date.
And this isn’t just a crummy seasonal period – it actually might signify that something much larger is happening.
But luckily, we have a suite of handy TradeSmith tools, screeners, and systems to show us how to navigate these choppy waters.
Here’s what I mean…
2008… All Over Again?
As an investor who lived – and managed money during – the 2008 global financial crisis, the stunning slump in financial stocks gets my attention… and not in a good way.
I can recall as if it were yesterday, how financials began underperforming the stock market in early 2007. That’s when two Bear Stearns funds investing in subprime mortgage loans went bust.
Most investors didn’t give it much thought at that time. In fact, the S&P 500 kept climbing for another four months.
But just a year later, Bear Stearns itself was gone – and the rest of the global financial system went into a death spiral.
Financial stocks were the “canary in the coal mine” – the first sector to sell off and warn of the bear market to come.
This walk down memory lane is due to some eerie similarities between subprime mortgage lending back then and private credit lending today.
Several investment firms have recently halted investor redemptions from their private credit funds – just as Bear Stearns tried, and failed, to do 19 years ago this month.
You can read the gory details here or in other financial publications. But suffice it to say that private credit is a $1.8 trillion industry, one that has attracted plenty of hot money in recent years.
And now its troubles are putting the entire financial sector under increasing stress.
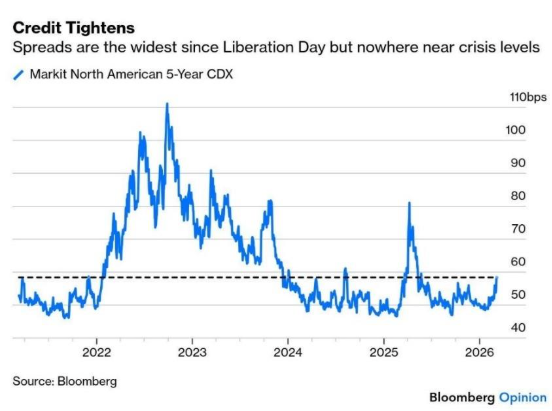
As you can see above, credit default swap spreads just spiked to their highest level since the tariff trauma this time last year.
Credit default swaps are basically insurance policies bought by big Wall Street institutions against the risk that borrowers will default on bond or loan repayments.
These swaps only “pay off” due to losses from a system-wide credit crunch, such as the 2008 financial crisis. So, when credit default swaps rise in value, it means Wall Street is getting worried.
The worry is that credit risks are rising in the financial sector, which could signal a credit crunch in the making. And if that’s the case, the downside risk for stocks could extend well beyond just the financial sector.
So how do you spot these warnings signs before the rest of the market catches on?
Let’s have our TradeSmith tools show us how…
How TradeSmith Is Tracking the Risk
In today’s turbulent markets, TradeSmith members should keep a watchful eye on our Market Outlook page, specifically the list of market indexes and sectors.
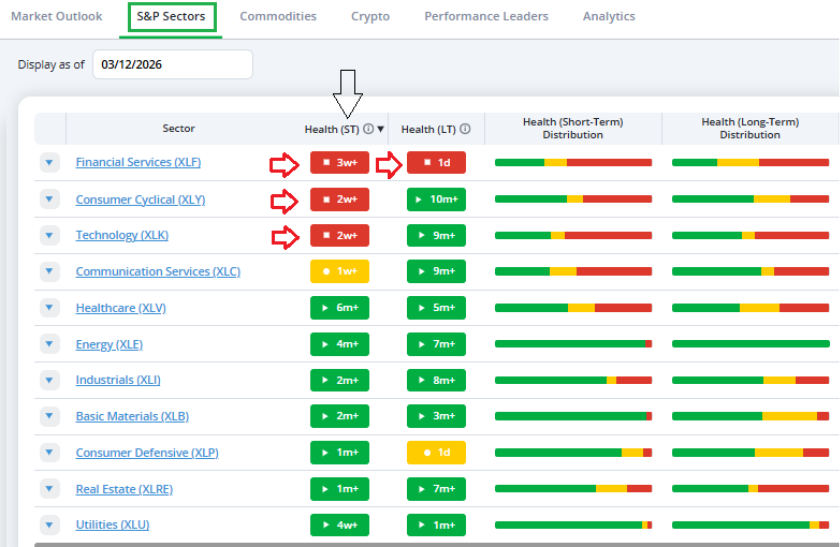
The XLF, which I mentioned earlier, fell into our short-term Health Indicator Red Zone in mid-February.
You can think of this indicator as a “flash sell alert” signaling that more downside may lie ahead for financial stocks in the near term.
XLF is one of three sectors to trigger this flash sell alert in recent weeks. Technology and Consumer Cyclical are the other two, as you can see in the chart above.
This could be a sign that financial stress is already spreading to other sectors.
XLF also entered the long-term Health Red Zone just yesterday. This means XLF has now stopped out, according to our long-term Health indicator as well. .
In other words, a more prolonged downtrend in XLF is likely.
Simply click on the Financial Services (XLF) link to see more details about the sector’s health.
You can also click here to view the Holdings page for XLF – it’s not a pretty picture.
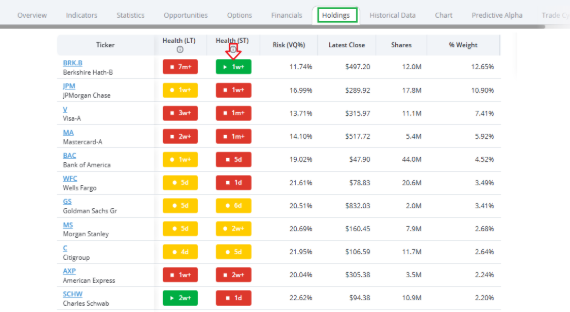
You’ll see that many blue-chip financial stocks – including JP Morgan Chase (JPM), Bank of America (BAC), and Wells Fargo (WFC) – have recent flash sell signals of their own. The same is true for big credit card companies, Visa (V) and American Express (AXP).
These stocks should not be considered buys until their health improves. And if you already own them, you may want to consider selling – or at least setting a tight trailing stop on these stocks.
But it isn’t all bad news in the financial sector.
In the Holdings view, click on the Health (ST) column heading, and you’ll see several major insurance stocks that have recently moved into the Green Zone – flash buy signals – including Berkshire Hathaway (BRK.A).
These are the stocks you may want to consider holding or even buying as healthier financial sector investments right now.
Meanwhile, steer clear of Red Zone stocks.
And the same is true for every other sector. Let’s take a closer look at tech.
What Our Health Indicator Is Revealing in Tech
Click on Technology (XLK) – another sector currently in the Health (ST) red zone. Then navigate to the Holdings tab for XLK and click on the same Health column to sort.
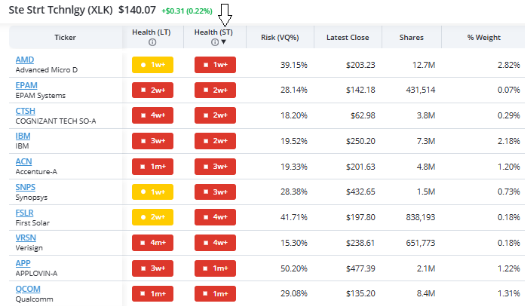
At a glance, you can see some blue-chip tech stocks – including AMD and IBM – that triggered flash sell signals in just the past few weeks.
Again, that means more downside may be possible in these stocks. So, they should be avoided for now until their health improves.
Now click on Health (ST) again to view the most recent Green Zone tech stocks.
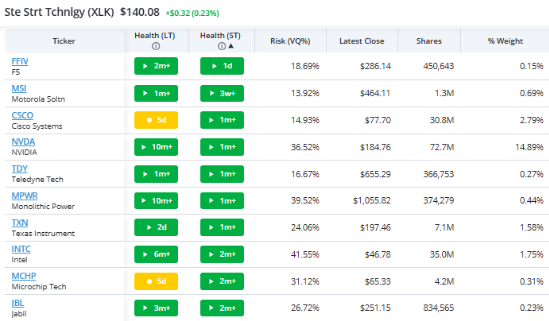
Here you can see at a glance which tech sector stocks are rising to the top in terms of our Health (ST) rating.
Despite recent market weakness, these stocks delivered bullish flash buy signals! This includes tech leaders like Nvidia (NVDA) and Texas Instruments (TXN).
Mike Burnick’s Bottom Line: Even in stressed out markets – and stressed sectors – you can still find opportunities. Our proprietary Health Indicator Green-Yellow-Red light system is a great place to start finding them. It highlights both healthy (Green Zone) buying opportunities and unhealthy (Red Zone) sectors and stocks that you should strongly consider avoiding.
Good investing,
Mike Burnick
Senior Analyst, TradeSmith
P.S. What we talked about today is exactly why having an edge like the ones TradeSmith tools provide is more important than ever.
Because the difference between protecting your capital… and getting caught in the next wave of losses often comes down to timing.
And that’s precisely why I want to make sure you see a new tool that TradeSmith CEO, Keith Kaplan, just released.
He recently unveiled a new software designed to help investors identify buy and sell signals before major moves happen – including the kind of market stress we may be heading toward now.
In fact, this tool would have helped investors capture gains like 520% in nine months on MCRB before a 98% crash… 150% on DNLI before a 78% collapse… and even 1,160% on BLNK before it plunged 89%.
The idea is simple: Lock in gains early – and step aside before the damage begins.
Keith walks through exactly how it works in a short presentation – but catch it before it’s too late.