

Last week, Federal Reserve Chairman Jerome Powell made the call the market has waited all year for: “The time has come for policy to adjust.” In other words, interest rate cuts are on the way – and we could see them as soon as the next Fed policy meeting in September.
That’s good news. But how should you act on it?
Well, I’ve mentioned before that the promise of lower rates has caused shifts in market leadership over the last few months… and that in times of high market concentration as we’re seeing now, picking up individual high-quality stocks beats index investing by a mile.
And with perfect timing, TradeSmith’s top-notch software development team has just made it even easier to pick your next great position out of the thousands of stocks on the market.
The team is always busy working on new expansions and improvements to the TradeSmith Finance platform, adding new indicators, filters, and interesting trading strategies to the long list of features already available on our website. And they’re always listening out for suggestions from our team of analysts, editors, and dedicated users like you.
A while back, I sent a suggestion to the programming team myself, to see if they could add new filters to our Opportunities page. And they delivered on that suggestion much quicker than I expected! Come to find out, they had this improvement in the works all along.
I guess great minds do think alike.
So, let me take you on a guided tour of the new and improved Opportunities page. Starting with the before and after pictures – they’re worth a thousand words.
Before: The page offered a simple selection of basic filters to choose from.
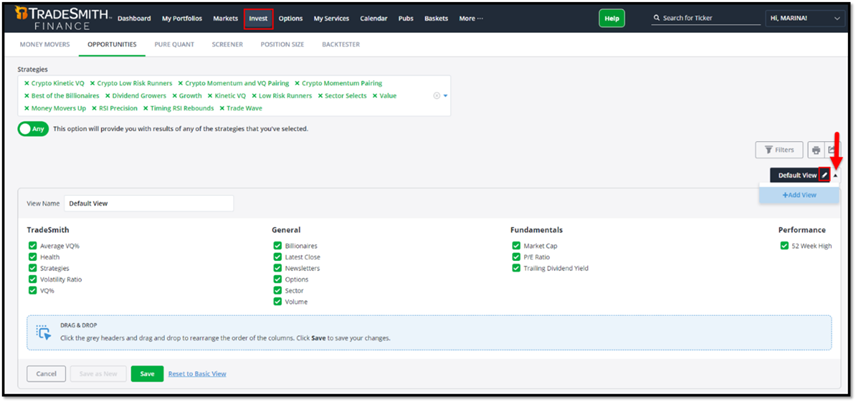
After: We’re getting the whole enchilada! With the full suite of TradeSmith filters you know and love.
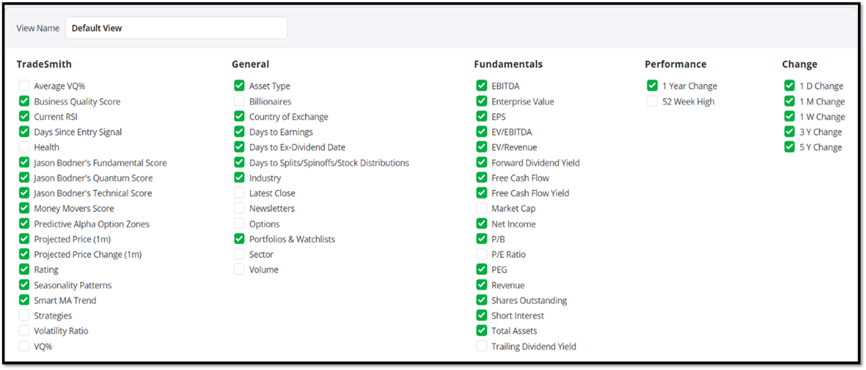
Now, you can scan for opportunities with all the same filters you can use on the TradeSmith Screener page. That’s a big improvement – because whether you’re running one of your own favorite screens, or looking for new opportunities you hadn’t considered, you’ll see that all the same data points are well represented.
You’ll find we’ve added TradeSmith, General, Fundamental, and Performance-based filters to the Opportunities view. And just like the Screener view, it is fully customizable, so you can make it your own.
Some of these filters are available with a variety of subscriptions, and I have access to them all thanks to my TradeSmith Platinum membership. If you don’t see some of these in your TradeSmith Finance platform and would like to, give us a call at 888-623-0858.
Personalize Your Tools with Custom Views
While TradeSmith offers a wide variety of filters, you don’t have to use them all at once. You can quickly and easily edit your Default View on the Opportunities page by simply clicking the white edit pencil icon in the same tab (see the red arrow in the above “Before” graphic).
Or you can just as easily create an entirely new view from scratch by selecting “Add View” from the drop-down menu. Then add whichever filters you find most useful from the menu. In other words, make TradeSmith Opportunities your own!
As a quick example, I pulled up one of my favorite strategies from the TradeSmith Ideas Lab, Dividend Growers, using the Opportunities tab:
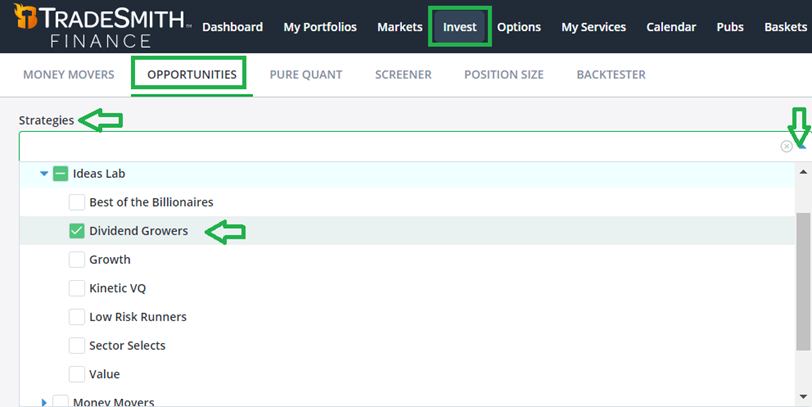
You can find this yourself by clicking on Invest from the main menu bar, then selecting Opportunities. Now click the Strategies drop-down menu and select Ideas Lab > Dividend Growers.
Here’s a partial screenshot of the results, with my preferred set of filters on display:
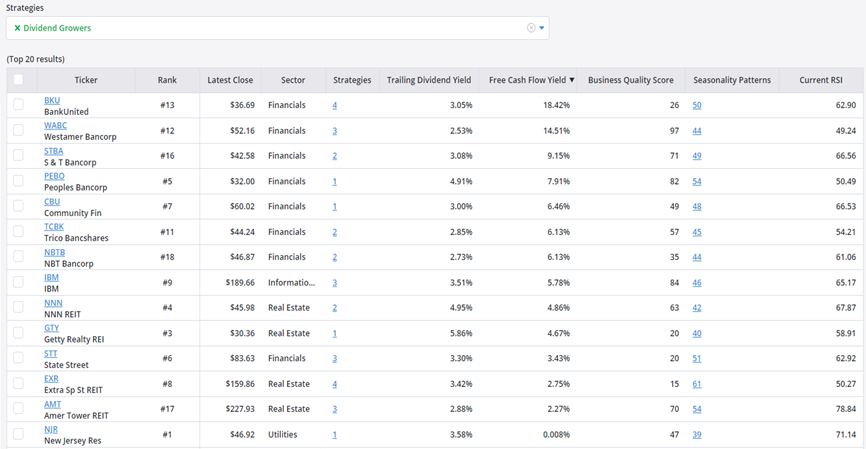
I use this combination of filters in my own analysis. I’ll briefly walk you through why I chose each one:
- Latest Close, Sector, and Strategies: these three filters give me the basics on each stock I review. Notice that I don’t have Health or Trend visible – that’s because the Dividend Growers strategy is already limited to only pick up on healthy stocks. So no need for those two filters here.
The Strategies column also shows you any additional TradeSmith strategies the stocks qualify for. Simply click on the highlighted number to see the list. For instance, in addition to Dividend Growers, BankUnited (BKU) is also a pick for the Best of Billionaires, Growth, and Kinetic VQ strategies. That’s a great combination in my book!
- Trailing Dividend Yield and Free Cash Flow (FCF) Yield: We know already these stocks pay dividends, based on our initial search. But I want to see how high the yields are, and with these two metrics, I can check those details at a glance.
Here’s a great rule of thumb for your own searching: Try to find stocks with an FCF yield greater than the trailing dividend yield. That means the company has plenty of extra cash left over to keep growing the dividend. Also, I would eliminate any stocks with negative FCF from consideration.
- Business Quality Score (BQS): The overall quality of the business is key to sustained growth and dividend payouts, and I want to know how it ranks before I take a closer look. The higher the better, but anything with a BQS above 50 is OK by me.
- Seasonality Patterns: Here you can see if there are any strong seasonal uptrends in the weeks or months ahead. That’s a key catalyst to propel the stock higher, as I’ve mentioned before.
- Current RSI: Finally, I want to know if the stock is overbought (with an RSI over 70) or oversold (with an RSI under 30). Lower is generally better – if the stock is trending higher.
Most of the results on this list include stocks in the financial and real estate sectors, which have both been very strong in recent months. Plus, with each of these Dividend Grower picks, you’ll get paid solid dividends while you wait for more upside.
From this list, Westamerica Bancorp (WABC) caught my attention right away: With a high FCF Yield of 14.5% and a solid Current Dividend Yield of 2.53%, it looks incredibly appealing. The stock also has a sky-high BQS of 97 – and the RSI is relatively low at 49.24, which means more room to run up before it gets overbought.
Now, let’s take a closer look at seasonality to see if there are any bullish patterns ahead. Simply click on each highlighted number in the Seasonality Patterns column to see all relevant patterns for the stock:
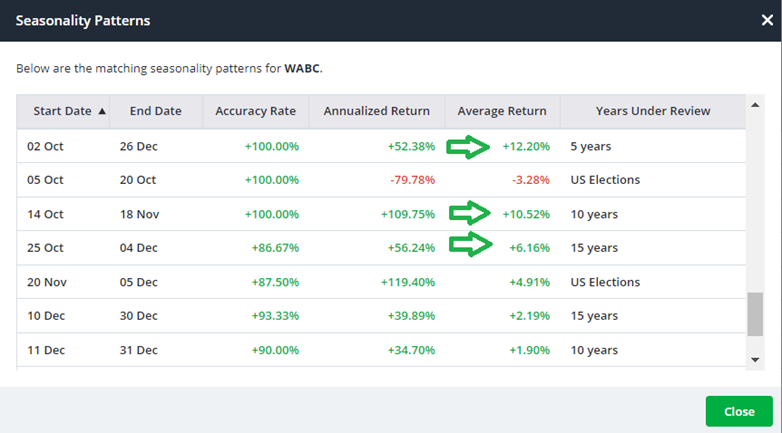
Sure enough, WABC has several seasonal patterns worth noting as we move into the end of the year, with some carrying double-digit profit potential. This includes potential returns averaging 12.2% from Oct. 2 to Dec. 26, based on the past five years. That’s supported by a possible 10.52% gain from Oct. 14 to Nov. 18, judging by trends from the past 10 years.
Granted, it’s never a good idea to rely on a single indicator to guide your trades, Seasonality included, because these yearly patterns don’t always repeat. But WABC will be on my radar for more in-depth research!
Mike Burnick’s Bottom Line: I visit the TradeSmith Opportunities page on a regular basis each week. For my money, it’s a great way to quickly find new trading and investment ideas – and it’s one of the many great resources available to you on the TradeSmith Finance platform right now.
And now we’ve made it even easier to do initial data analysis right from this page. Simply create your own opportunities page view with the filters you find most appealing and useful, and let our tools and data streamline your investment decisions. Just don’t forget to visit it often: there are always new opportunities to uncover.
Good investing,
Mike Burnick
Senior Analyst, TradeSmith
P.S. While using our TradeSmith tools is a unique, ever-upgrading (and my personal favorite) way to find and screen for new trading opportunities, I’d be remiss not to explore the other amazing methods out there – especially ones that can give you the ability to make critical investment decisions before everyone else does.
Here’s what I mean…
Brothers Andy and Landon Swan, TradeSmith’s business partners over at Derby City Insights, are proud to present a system that can harness data from hundreds of public companies, match it with “consumer chatter” to see what real people are saying, and translate it into tailored trade recommendations… before any of the news breaks into the major financial headlines.
The Swans call it the “Social Heat Score,” and the proprietary technology behind it can lead to record-breaking returns, like a 217.66% return on DraftKings (DKNG).
With the Fed more than likely to cut interest rates next month – and to allow the market to breathe a sigh of relief in the process – more and better trading opportunities are just around the corner…
And it’ll pay to know before they make the big news.
Click here to check out what these two market masters have cooked up.