Get Ready for These Underperforming Sectors to Soar
Nothing lasts forever.
We’ve seen that clearly this week as the market has begun what seems to be a new “rotation cycle.” This phenomenon happens when previously high-performing market sectors pass the torch to underperformers – effectively “flipping the switch” on market gains.
Case in point: AI darling Palantir (PLTR) reported stellar results this week, beating estimates in every way. But in two days, PLTR plunged 10%.
While PLTR shareholders might not be thrilled, this does not mean that the market is in for a correction.
Rather, it may be signaling that it’s time for a long overdue market or sector rotation.
When sector rotations happen, traders and investors don’t yank their money out of the stock market like they do during a mass selloff.
Instead, they’re moving their cash from market darlings into the less glamourous, undervalued, and oversold stocks. (Think energy, healthcare, and consumer sectors.)
Tech and AI names have been in the spotlight for most of this year, with most other stocks pretty much left for dead.
This shift presents potentially huge opportunities – and they’re bubbling just beneath the service.
Let me show you how to find them.
Rotation Beneath the Surface
A great resource to help identify these rotational opportunities is with my colleague Jeff Clark’s Short Term Convergence screen on the TradeSmith website.

Jeff is one of the few professional traders I know who has a slight edge on my experience… with over 40 successful years in this business (I’m at 37 years – and counting!).
He’s based on the West Coast, in Northern California, so we don’t get a chance to meet often enough to talk shop.
But I recently got the chance to sit down with Jeff at a conference in Washington, D.C., and over dinner, we talked about our favorite subject: the markets.
Jeff agrees with my view that we’re likely to see a shift in market trends over the next several weeks – “All those stocks that have underperformed will start performing,” in his own words.
He expects money will be coming out of some of the hot, overbought names and rotating into more undervalued blue-chip stocks.
And that’s exactly what’s been happening over the past several days.
Jeff’s preferred way to find these stocks is at the heart of his Convergence/Divergence analysis – a method he’s perfected over many years.
I’ll show you how to find it – and make it work for you.
Spot Big Moves with Top Convergence & Divergence
First, log into TradeSmith Finance. This will open to your home page, or the Dashboard.
On your Dashboard, scroll down to find Jeff Clark’s Short-Term Convergence.
Please Note: If you don’t see Jeff’s Short-Term Convergence or TradeStops tools on your TradeSmith Finance dashboard – and would like to – please give our Customer Care team a call at 888-623-0858 to learn more.
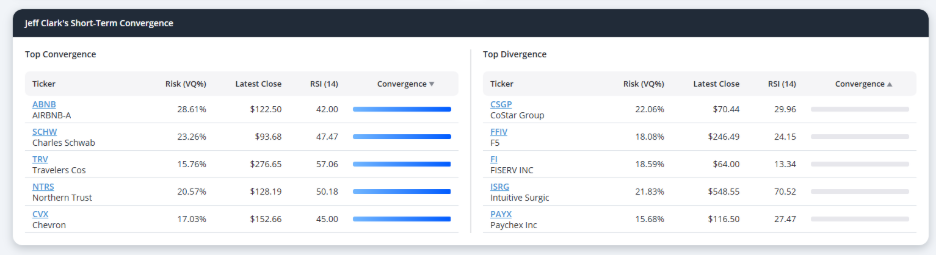
At first glance, it is hard to tell what this tool means – some stocks have a blue line, and others don’t.
But let me break it down for you:
The Top Convergence section of the screen (on the left) displays stocks that are set up for a potentially big move.
The signal doesn’t specifically favor a bullish or bearish direction. As Jeff says, it just tells you that, “When this stock makes its move, it’s going to be big.”
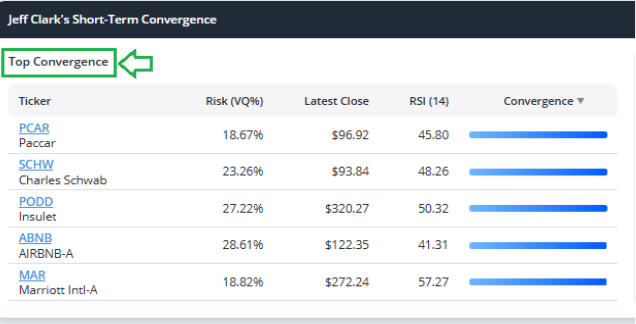
This is where you have to put on your analyst’s hat – if you like the stock, it may be time for a long position. But if you dislike it, you might consider shorting the stock or buying put options on it.
Meanwhile, on the right side of the screen is the Top Divergence list.
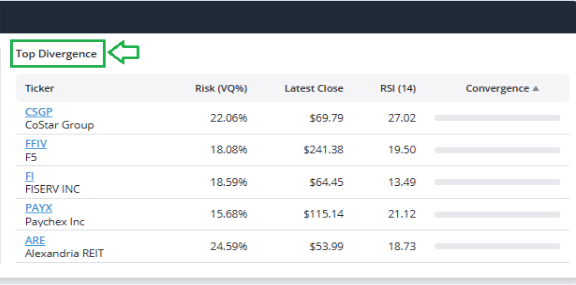
Divergences are where it gets interesting – and where the big profit opportunities come into play.
This list includes stocks that are trading extremely far away from their key moving averages.
And this creates a powerful setup for a possible “snap-back” move.
Think of stretching a rubber band to its limits – not far enough that it breaks, but far enough that when it snaps back into place, it’s going to be big and it’s going to be quick. And when stocks on Jeff’s Divergence list that are oversold (energy, healthcare, consumers) see a pretty big snap in price, they could be interesting buy candidates.
(You could also consider out-of-the-money put options on these stocks. That way, you can earn immediate income while aiming to buy the stock at an even cheaper price.)
But for overbought stocks on the list that are overbought (tech, AI), you might consider selling if you already own them – or consider buying put options on them.
But let’s dig a little deeper and show you a real example…
Building Energy for a Big Move
Airbnb (ABNB) is on the list of top convergence stocks, so let’s use it as an example to show you how I use Jeff’s powerful Convergence screen.
I’ve long been a fan of ABNB and personally use their app all the time to book vacation stays.
The stock has been in a sideways consolidation pattern for several months – as you can see below –building up a lot of kinetic energy for a bigger move.
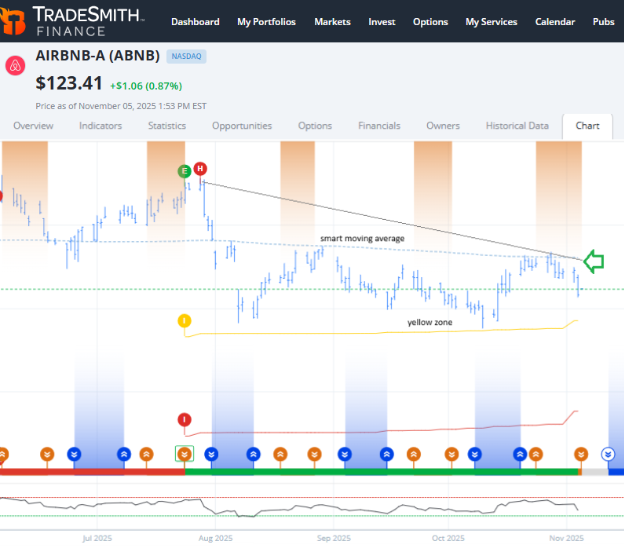
Right now, ABNB is trading in a range just above its Health Indicator Yellow Zone and just below our TradeSmith Smart Moving Average.
- The Health Indicator Yellow Zone means it is time to be cautious, just like a yellow traffic light.
- The Smart Moving Average shows the trend of a stock.
This is a classic convergence, which is why ABNB makes Jeff’s list.
ABNB is also relatively cheap today, with shares down about 12% over the past few months due to widespread fears of a slowdown in consumer spending – which could hurt travel-related stocks.
In fact, ABNB is now trading at just 12X cash flow, compared to its average of 56.8X over the past five years, that’s quite a discount!
While I’m tempted to buy here, I also know the stock hasn’t declared its intended direction yet – it could be either up or down. Plus, ABNB is set to report earnings this week.
So, it’s best to tap into that rarest of investor virtues – patience – and wait to see how it plays out.
So, I add ABNB to a watchlist portfolio, together with other Convergence/Divergence stocks I’m actively tracking. That’s an easy task with TradeStops at your disposal.
Next, I set an alert (as shown above) to notify me if the stock moves above its recent highs at $128.
Set it and forget it, then wait patiently for the outcome of this divergence.
Mike Burnick’s Bottom Line: No matter whether you’re an active trader or a longer-term investor, you can generate plenty of interesting ideas with Jeff’s Covergence/Divergence screen on TradeSmith Finance. You can add dozens of convergence stocks to your watchlist and wait patiently for the big moves to play out – then make your move when the timing is just right.
Good investing,
Mike Burnick
Senior Analyst, TradeSmith
P.S. The bottom line is clear: Jeff Clark’s Convergence/Divergence screen can help traders uncover hidden opportunities in overlooked corners of the market – especially when big money starts rotating out of overcrowded, overbought names.
But while some stocks are quietly building strength beneath the surface… others are flashing a very different kind of signal.
Right now, a historic warning alert is firing across Wall Street – the same type of pattern Jeff first recognized before several of the most devastating market crashes in history.
He calls it “The Breaking Point.”
It’s the same setup that appeared before the 1987 crash, the Dotcom bust, the 2008 meltdown, and the 2022 tech collapse that sent Palantir plunging 55% in just 37 days.
Now, Jeff’s spotted this signal again – on Apple, Tesla, and more than 60 other S&P 500 stocks.
It could turn a potential crash into one of the biggest wealth-building opportunities in years.
And Jeff’s revealing how his private “anti-bubble” strategy helped followers sidestep losses – and even capture triple-digit gains during past market chaos.