Here Comes the September Slump! Buy the Dip and Earn Income in the Process with This Options Strategy
Stop me if you’ve heard this before, but investors beware – September’s brought a chill to the air… and it’s coming for the stock market next.
This month has a bad (and well-deserved!) reputation among investors. But as Mark Twain once said, “there are lies, damn lies, and statistics.”
Twain makes a good point: You can’t take every stat you see at face value… and when it comes to September’s stock market results, that’s just as true. In truth, it turns out that if the trend is your friend, September isn’t so bad for the market.
Still, volatility is likely to rise this month, after a multi-month streak of new lows. And the combination of a possible stock market pullback, along with higher volatility, spells opportunity for savvy investors…
Let me explain, starting with a review of September’s bad reputation.
A New Month Brings New Seasonality
September is, statistically speaking, the worst month of the year for stocks. Over the past 75 years, the S&P 500 has been up in September just over four times out of ten – posting an average loss of -0.7%.
And as you can see below, in the TradeSmith Seasonality chart for the S&P 500, over the past 35 years the path of least resistance for stocks in September is definitely down:
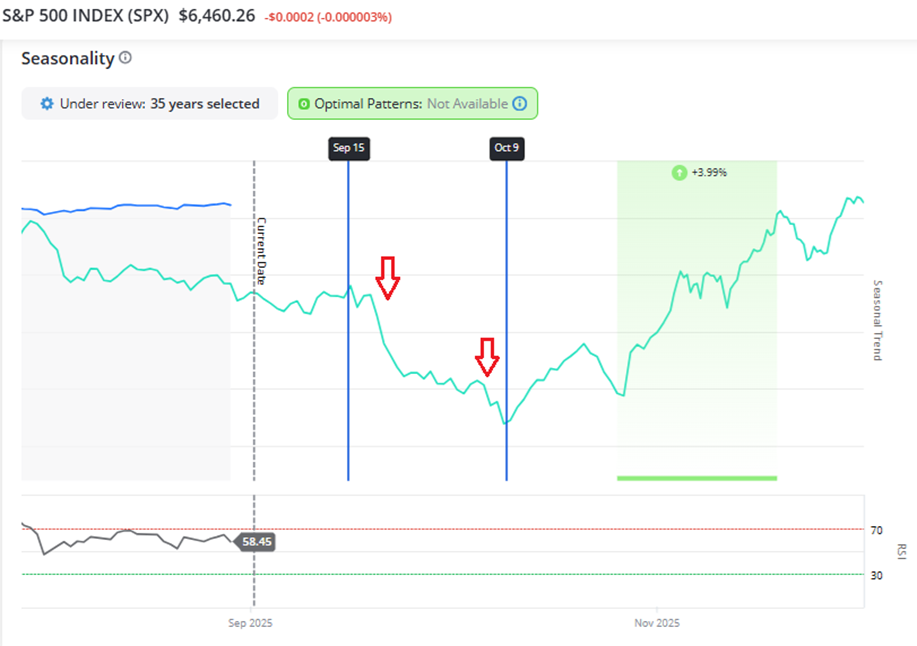
It’s worth noting that historically, the worst of the seasonal declines start around mid-month, before prices continue lower into October.
We can take a closer look at this seasonality data through the full Trade Cycles Seasonality tool, available to members subscribed to Trade Cycles or TradeSmith Platinum. By exploring the data and examining this seasonal slump period with a different number of years under review, we get slightly different results – but the negative direction is the same.
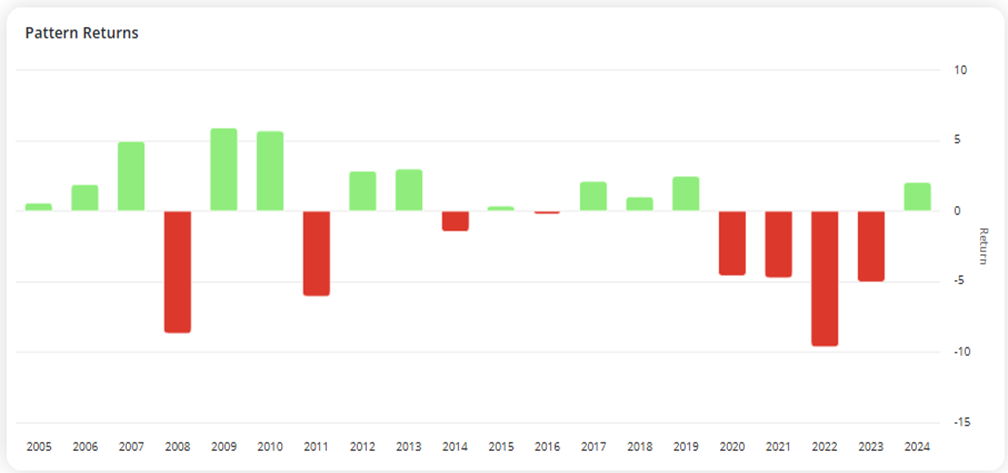
But, if you zoom in on the data… looking at the annual Pattern Returns bar graph shown below, you’ll notice the results are a bit skewed to the downside by a few very bad Septembers:
If you’d like to explore this data yourself, our Seasonality data is available via the Trade Cycles tab on the Asset Details page of any stock or asset in our database.
If you don’t see that option on your TradeSmith Finance platform, and would like to, simply call 888-623-0858 to speak with our Customer Care team and learn how to get access.
Now, over the last 20 years of market history, the worst Septembers by far came in 2008 and 2022 – with both months occurring in the midst of bear markets for stocks that were already well underway by the time September rolled around. And the steep loss seen in September 2011 came during a near bear market, with the S&P 500 quickly falling almost 20%.
These skewed results in certain Septembers get me thinking: It appears that the stock market’s trend heading into September has a lot to do with path prices take during September.
And sure enough, it turns out that if stocks are trending higher entering September, they tend to perform well during the month.
Specifically, if the S&P 500 Index (SPX) is trading above its long-term 200-day moving average (200DMA), stocks are up 60% of the time in September, posting average gains of 1.6%! That’s according to data from LPL Financial.
And currently, the S&P is well above its 200DMA, to the tune of more than 400 points, after notching a new high just last week.
So, the stock market’s existing trend is good news for potential September returns. But despite that tailwind, overall market volatility still has a seasonal tendency to move up in September and October, as shown by seasonal data from the CBOE Volatility Index (VIX):
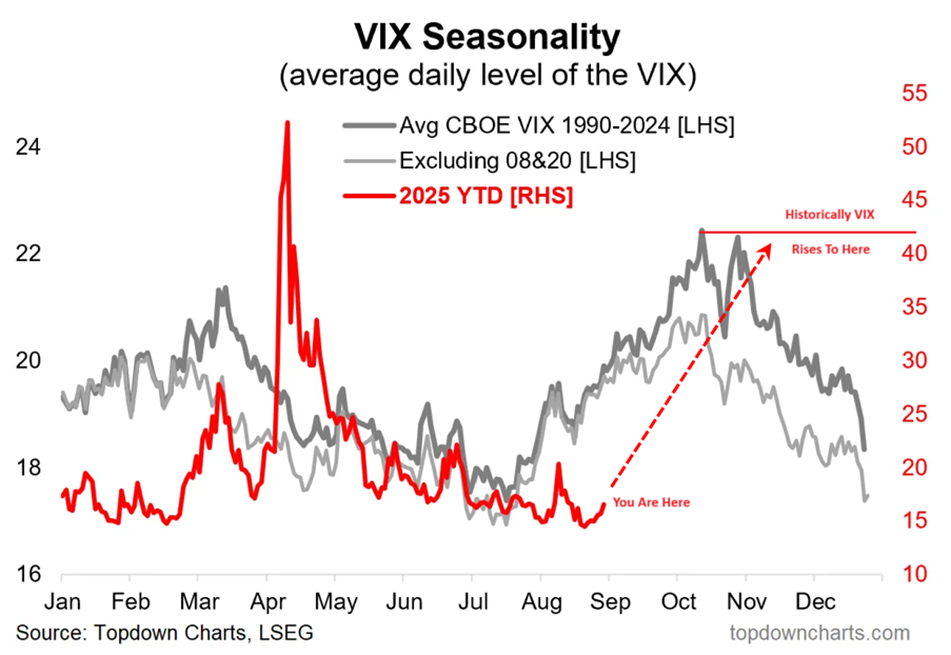
Based on this historical data, it’s certainly possible that we might see a spike higher in the VIX – which acts as the stock market’s “fear gauge” – on any short-term pullback in stocks over the next two months. That’s especially true considering the very low starting point for VIX as we enter September, with the index closing Friday at just 15.36.
And while the existing market trend doesn’t signal a disastrous month ahead, a September pullback would likely be a good stock buying opportunity. And for savvy traders, it would also be a great opportunity to aim to buy stocks at a discount, while getting paid to do so!
Time will tell whether or not we see prices fall this month, but we can get ready for whatever September throws at us by making our potential stock shopping lists now. And there’s no better tool to do that than the powerful TradeSmith Screener tool!
Preparing for September with TradeSmith Screeners
First, let’s set up a TradeSmith Screener to search for stocks likely to buck the typical seasonal downtrend in September.
Here’s how to go about it.
First, be sure to log in to your TradeSmith Finance dashboard, then select the Invest page from the navigation bar at the top of the screen. Next, click the Screener tab on the following page to access our customizable market-scanning tool.
As a reminder, you must be subscribed to Trade360, TradeSmith Platinum, or Ideas by TradeSmith to have access to this powerful tool.
If you don’t see this tool on your platform, but would like to, simply call 888-623-0858 to speak with our Customer Care team and learn how to get access. Then you can build your own stock screeners with just a few clicks!
On the following menu, click the + Add Filter button to customize your search. For this screen, I’m using the six filters shown below:
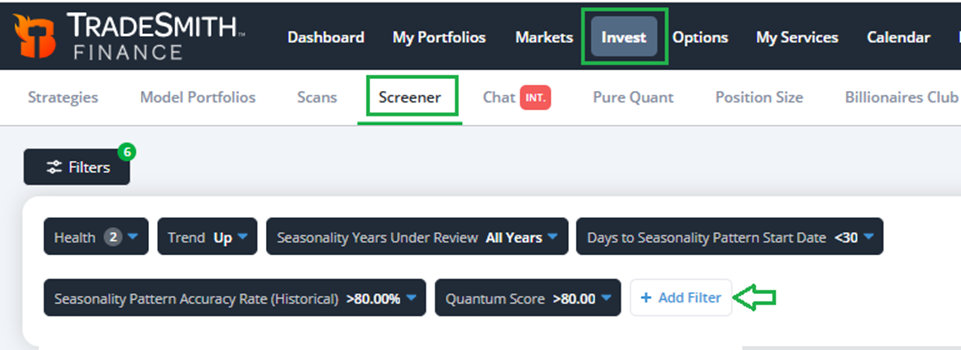
The main filters I’m using for this screener are:
- Health: I want healthy stocks doing well coming into September, so we’ll set this to search only stocks in the Green Zone and Yellow Zone,
- And Trend: Set this to Up to select only those stocks with positive trends.
You’ll find both the Trend and the Health filter categorized under TradeSmith Proprietary Metrics.
Next, we’ll use a few filters linked to TradeSmith’s specialized analytics. Some of these filters may not be available to you, depending on your subscription level.
Since we’re starting a seasonal weak month for stocks, let’s further screen for stocks with favorable seasonality. We’re trying to zero in on stocks that can resist a market pullback – so we’ll use the following filters found under the TradeCycles by TradeSmith header:
- Seasonality Years Under Review: Set to All Years, to make use of the full breadth of historical market data at our disposal,
- Days to Seasonality Pattern Start Date: Set to less than 30 to filter for stocks with a favorable seasonality over the next 30 days (that is, September going into October),
- And Seasonality Pattern Accuracy Rate (Historical): Set to 80% or more.This will ensure we’re only looking at the strongest seasonal patterns.
Finally, let’s add another element of upside momentum focusing on money flows using Jason Bodner’s Quantum Score (found under the Quantum Edge Scores category). It’s designed to spot Big Money flowing into or out of stocks – with Jason’s scale running from 0 to 100, with 100 being stocks with the strongest Big Money flows.
- Quantum Score: Set this filter to 80 or more, to give us only the top 20% of stocks with the largest Big Money inflows.
When I ran this screen today, I got 53 results. Here’s a partial list, sorted by Business Quality Score (BQS):
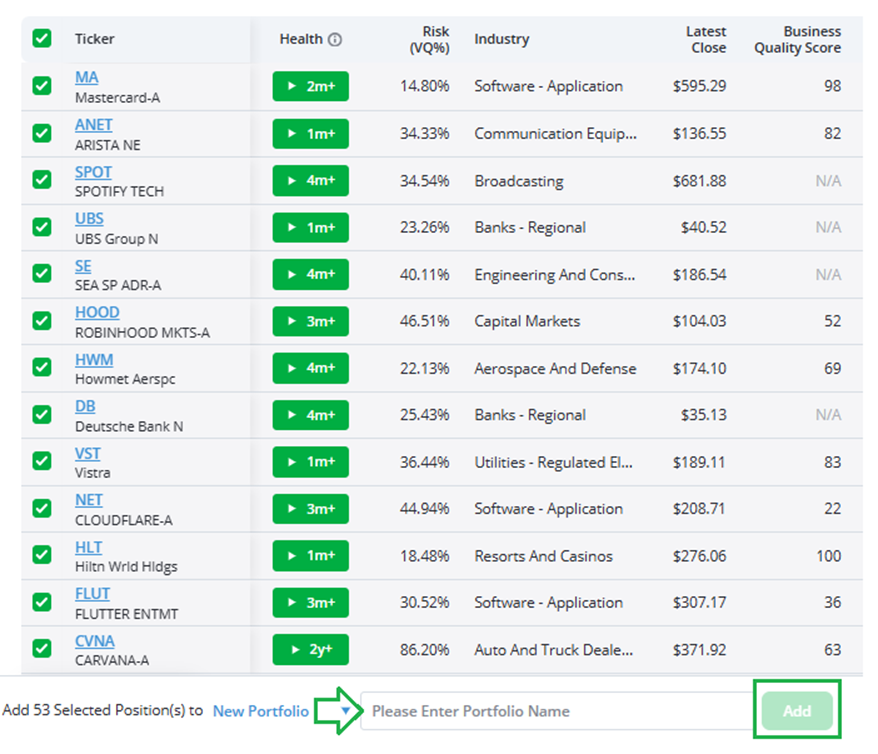
Now, let’s save this list as a New Portfolio by simply clicking the check box at upper left of our results window, next to the Ticker header, to select all the stocks in our results.
Then at the bottom of the page, simply add all stocks to a New Portfolio by typing in a portfolio name (I used “Seasonal Sell Puts” for my portfolio list) and clicking on the green Add button.
This allows you to save your results and use them in other screens – or simply monitor the list of stocks for any changes.
Next, let’s set up an Options Screener to search for Sell Put trades on the stocks that made the list, after our prior screen.
To access the Options Screener, simply click on Options from the main menu at the top of your TradeSmith Finance platform, then click on the Options Screener tab.
Now, let’s add some filters, just as we did with our last screener…
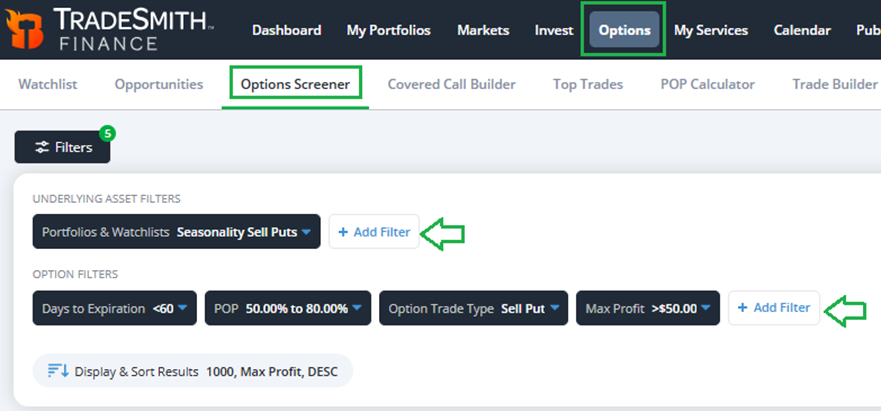
First, for Underlying Asset Filters, click the + Add Filter button and select Porfolios & Watchlists. This allows you to seach for and click on the portfolio list you just saved – “Seasonality Sell Puts,” in my case.
Under Options Filters, I added these four filters:
- Days to Expiration: Set to less than 60,
- POP (Propability of Profit): Set between 50% and 80%,
- Option Trade Type: Only choose Sell Put,
- And Max Profit: Set to more than $50.
When I saved and ran this screen on my Seasonal Sell Puts list, I got 165 results. Here are a few sorted by the highest Max Profit (premium income you earn by selling the put) at the top left:
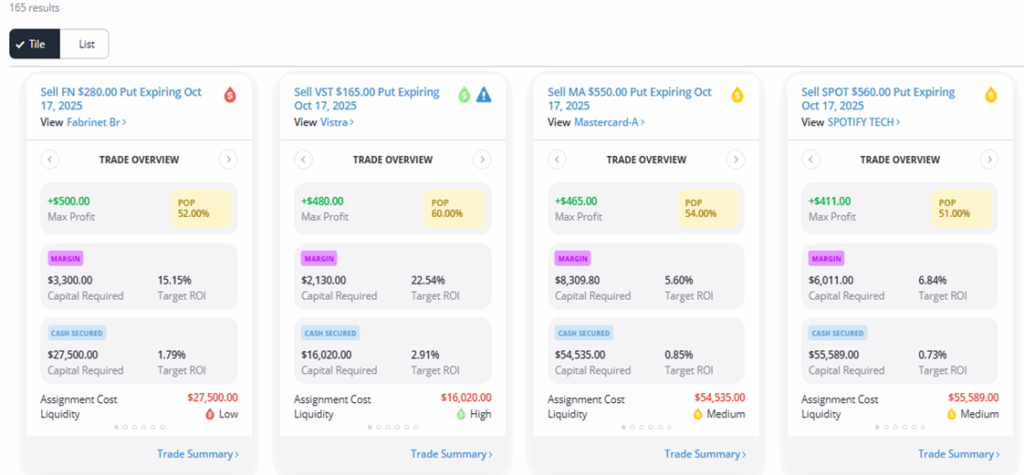
Now, you might be thinking, why sell put options on these stocks, instead of buying calls?
Well, for my money, selling puts on quality stocks you’d like to own (or would like to profit from) stacks the odds in your favor. Especially in a seasonally weak period with volatility likely on the rise – like September historically is.
Higher volatility is your friend when selling puts… and your foe when buying calls. That’s because you get paid premium income upfront to sell a put option. And the higher the volatility, the more you can get paid!
There are two reasons why you may want to do this:
- To try and buy a stock you want to own at a discount, while being paid for your time, or
- To simply get paid premium from your options trade, with very high odds of success.
With our TradeSmith Options Screening tools you can do either… or even both.
So, let’s recap briefly:
We have a list of healthy, up trending stocks, that are starting a seasonal bullish pattern and that are experiencing strong Big Money inflows.
These are stocks that can likely buck any downtrend in the overall market. They may dip with the market, but could be great buy the dip candidates.
Next, we ran a screener to sell puts on some of these stocks. Perhaps some stocks we would want to buy on the dip.
If that’s the case, you might consider trades in our Options Screener results with a medium Probabilty of Profit (POP) score around 50% – or with roughly 50/50 odds of being assigned and put the stock.
Or, if you’d rather just earn income without much chance of getting assigned, then consider a higher POP in the 70% to 80% range. In this case, you only have roughly 20% to 30% odds of being assigned – which would leave you without stock when your option expires, but keeping all of the premium provided upon the initial sale of the put option.
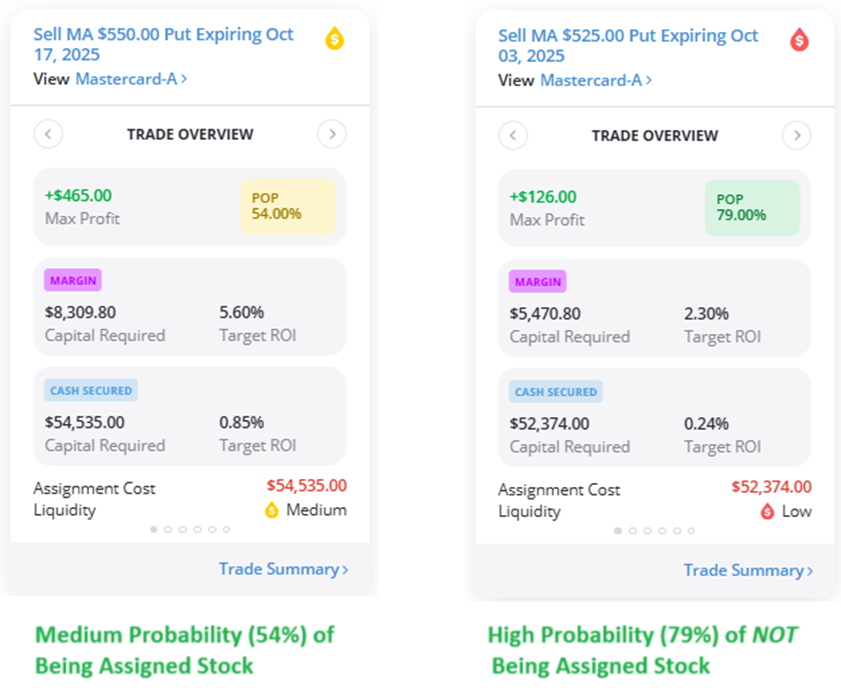
It’s your choice. Now, let’s look at two alternative trades for the same blue chip stock – that illustrate your option choices when it comes to this strategy:
Mastercard (MA) is a high-quality stock in a cash-cow business. It has a bullish seasonal period coming up, and big money is already buying MA shares according to our initial screen.
Let’s say you want to buy MA shares too.
Why not buy your shares on a dip, by considering the option at left?
Our second screen suggests this trade: Sell MA $550 Put Expiring Oct. 17, 2025.
By taking this trade, you would get paid $465 in optionpremium upfront in exchange for the obligation to purchase MA shares at $550 if the stock was below that price by Oct. 17. Each individual options contract represents 100 shares of stock, so this would cost $54,535 after factoring in the initial $465 in premium.
According to our Options360 analytics, you have a 54% Probability of Profit (POP) for this trade, meaning that there’s roughly a 50/50 chance of the option expiring out of the money (with the stock price above the $550 strike price) on Oct 17.
If so, you keep the initial $465 in option premium, with no further obligation to buy stock. Otherwise, if the option expires in the money and you are assigned shares, you get to buy MA at $550. That’s a 6.5% discount from where the stock trades right now. And you get to knock nearly $500 off the initial purchase price – that’s nearly a free share!
Now, behind door number two… Let’s say you’re just in it for the money.
Then you may want to consider the trade on the right of the screenshot above: Sell MA $525 Put Expiring Oct. 03, 2025.
This put option is more than 11% out of the money, so you’re far less likely to get assigned the stock – though it is still possible.
The POP for this trade is much higher at 79%, meaning there are high odds that this option expires out of the money, meaning you would secure the premium income without being obligated to buy any shares of MA.
But there’s a tradeoff: The premium earned on this trade is smaller, with your Max Profit capped at $126.
Bottom Line: Whether you’re buying quality stocks on a dip and earning income in the process, or just looking to earn income with an options strategy built around trades with a high probability of not being assigned shares of a stock, TradeSmith’s Stock and Options screening tools can provide you with plenty of money-making choices.
Good investing,
Mike Burnick
Senior Analyst, TradeSmith
P.S: September has a well-deserved reputation for stock declines. But as we’ve seen today, that doesn’t mean it’s time to pack up and avoid the markets until October.
Instead, we just need to be smarter about how we trade – and be more selective about the stocks we focus on. In today’s issue, we used our Screener tools to find stocks primed for a put-selling strategy that could take advantage of September’s higher volatility – but there’s more to take away from those screens.
September might be a scary month for some investors… but clearly, big money investors are still buying.
While many investors keep tabs on the moves of high-profile traders like Warren Buffet and Nancy Pelosi, there’s only so much we can learn from public filings and headline-grabbing announcements. Most of the big money flowing through Wall Street moves far more quietly… and is much harder to track. And by the time headlines catch on, the biggest gains are already gone.
That makes for a challenge – as keeping tabs on these major cash flows can be the difference between life-changing profits and getting left behind.
One of TradeSmith’s most powerful systems was built to solve this exact problem – built by a Wall Street veteran who became a partner at Cantor Fitzgerald at just 26, after years of executing billion-dollar trades for the financial elite. Our breakthrough system tracks massive money flows and uses quantitative analysis to spot explosive stock moves before they hit the news… so you can make the most of the opportunity.
If you haven’t guessed already, I’m talking about Quantum Edge.
The latest updates and upgrades to this cutting-edge system have made it one of the most effective tools in the TradeSmith catalog: Backtests show it could have delivered 8,100% gains since 1990, crushing the S&P 500 by more than 5-to-1.
Today, we used data from this system to find prime targets for options trades… but there’s so much more to it than that. It’s one of the most versatile tools in the TradeSmith arsenal, and one you’ll want to keep in your back pocket as we enter the most volatile month of the year.
To learn more about this quant system – and how you can use it yourself, click here.