Here’s an Easy Guide to Making TradeSmith Your Own
A mentor of mine in this business told me long ago that the key to success is to manage your losers, and your winners will take care of themselves.
Put another way, cut your losing trades short – so any losses are slight – and let your winners run. This key investing concept is what TradeSmith is founded on, starting with TradeStops, our very first service.
Now, with the screeners I’ll show you today, you can take this from “something I should get better at” to “the way I manage each and every trade.”
It’s incredibly important – and difficult – to practice this level of discipline.
Because once you own a stock, you’re invested in it – in more ways than one. So, when a stock moves against our expectations, it’s very difficult to be truly objective anymore. We’re only human, after all.
It’s too easy to rationalize away the possible downside. “I’ll just give it a bit more time and it’ll come back.” Famous last words.
It’s all about finding just the facts, ma’am – as Dragnet TV detective Sgt. Joe Friday used to say.
But too often we don’t gather all the facts before pulling the trigger on a new investment. Even worse, we ignore the negative facts staring us right in the face when a trade moves against us.
To help make you even more disciplined as an investor, we’ve added a wealth of data-analysis tools that take these competing facts and boil them down to simple, easy-to-read signals:
Our “green, yellow, red light” health indicator system, Trade Cycles and other trend indicators, stock ratings and our Business Quality Score (BQS), and Options360.
Heck, just within the past year we’ve unveiled powerful AI-driven analytics including Predictive Alpha, Jason Bodner’s Quantum Scores, and Seasonality indicators to complement our cycle indicators. The kind of tools that, until now, only professional money managers and hedge funds had access to. Even after 35-plus years in this business myself, I can tell you for a fact these tools have made me better.
Any one of these can help you be a better short-term trader or long-term investor, too.
The key is to harness these tools your way, according to what best fits your own trading or investing style and objectives. In other words, make TradeSmith your own!
So, here’s a template for how you might go about using multiple TradeSmith tools in your unique way.
How to Build Your Own Analytical Platform in TradeSmith
Log in to TradeSmith Finance, click on Invest, Screener, + Create new screener, and + Manage Filters, then add the filters shown below:
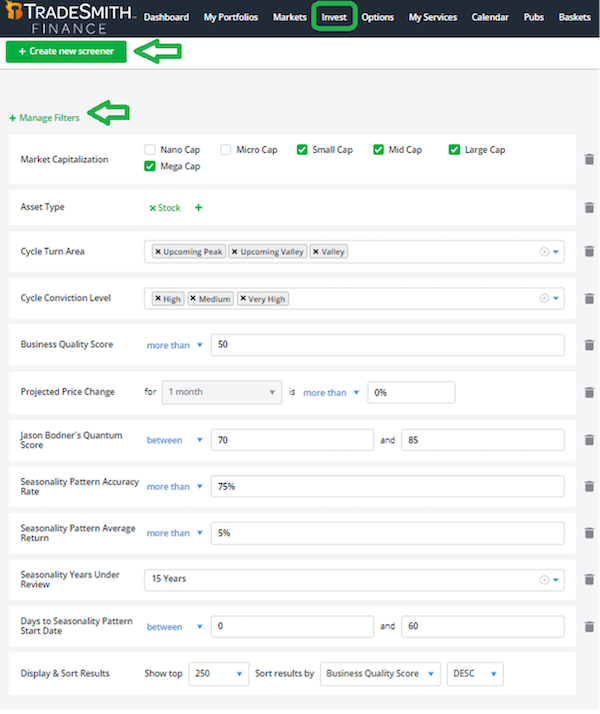
Here’s my rationale for choosing each of these filters and why they work well in combination.
- Asset Type: Stock and Market Capitalization: Small Cap, Mid Cap, Large Cap, Mega Cap
Here I’m looking for stocks from small cap on up, but you can use some of the filters below for other assets, too.
- Cycle Turn Area: Upcoming Peak, Upcoming Valley, and Valley
Valley or Upcoming Valley means the stock should soon turn higher. I’m including Upcoming Peak also, because if you think about it, a stock that is climbing higher toward a peak can still have good upside potential.
- Cycle Conviction Level: High, Medium, and Very High
The higher the conviction, the more we can rely on the cycle.
- Business Quality Score: More than 50
This limits Screener returns to stocks that are in the top half of all stocks we rate by quality.
- Projected Price Change: For 1 month is more than 0%
This our Predictive Alpha one-month price forecast; I’m only interested in stocks likely to move up.
- Jason Bodner’s Quantum Score: Between 70 and 85
As you may remember from previous issues of Inside TradeSmith, Jason considers this range ideal for adding new stock picks to his portfolio.
- Seasonality Pattern Accuracy Rate: More than 75%
- Seasonality Pattern Average Return: More than 5%
Now you’re also narrowing it down to stocks with bullish seasonal patterns that have shown high precision in the past and at least 5% upside potential.
- Seasonality Years Under Review: 15 Years
In my book, the more years included, the higher the seasonal potential, but 10 to 15 years is a good start.
- Days to Seasonality Pattern Start Date: Between 0 and 60
I’m looking for the seasonal upside pattern to kick in within the next two months.
Let’s take a step back to look at the bigger picture we’re painting here. With these filters, we’re combining bullish cycle timing, bullish Predictive Alpha price forecasts, and bullish seasonality. This way we have overlap from completely different indicators using different data inputs.
But they all point in the same direction for price: UP over long, medium, and short time frames.
We also have some intentional overlap with quality (BQS) and Jason’s Quantum Score. Recall, this overall score is a combination of bullish technical scores, fundamental scores, and the all-important Big Money flows into the stock. It’s a great mix.
As always, you can adjust these parameters as you see fit to get a bigger, smaller, or more focused watch list of stocks. This is a good starting point, but the key is to make this your own with more (or less) screener filters.
Now, let’s take a look at some of the results. Due to space constraints, I’m showing the top 10 results in the screenshot below, sorted by BQS.
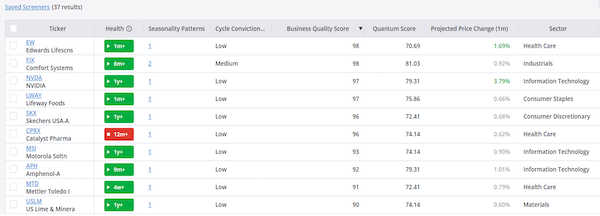
But here’s another point about making this your own: Sort the list multiple ways to get a clearer picture from different perspectives. You might sort by:
- Seasonality Patterns, to see stocks like Comfort Systems (FIX) that have multiple bullish seasonal price windows coming up.
- Or you could sort by Predictive Alpha’s Projected Price Change to get the highest one-month price forecasts at the top. In this list, Nvidia (NVDA) took top honors, with a one-month projected price change of nearly 4%.
With all the ways to sort, different results will grab your attention each time.
What’s interesting to me is that NVDA has already posted monster returns, and yet it still scored well on this diverse group of TradeSmith metrics.

Once you’re satisfied with the results, be sure to click on Save As New and give it a name. That way, you can return to the screener again and perhaps add new filters.
Also, if you click on the checkmark box at upper left of the results, you can save the results as a new portfolio or basket using the dropdown menu shown above. Then you can monitor these stocks as you do further research on each. Plus, you can set alerts that will tell you if they’re breaking out.
Remember that access to all of these Screener filters come from a subscription to TradeSmith Essentials or Platinum. And for my money, this level of access is well worth the cost. Just a few potential winning trades over a few months or a year and they could easily pay for themselves. If you don’t see these filters available when you screen for stocks — but would like to — simply call 888-623-0858 to discuss.
Mike Burnick’s Bottom Line: There’s no limit to how many different ways you can mix and match the various filters and indicators that you have at your fingertips at TradeSmith. It is truly institutional-class research similar to what hedge funds pay big bucks for, and it’s available right on your PC or in the palm of your hand on your smartphone. The best part is you don’t have to commit to just one system. You can set the screener filters you choose to customize the data as you desire, find what works for you, and make it your own.
Good investing,

Mike Burnick
Senior Analyst, TradeSmith
P.S. Have you enjoyed Jonathan Rose’s live trading sessions so far? Just since holding his Masters in Trading Summit last Wednesday, Canopy Growth (CGC), for example, popped from $8 to over $14 within 24 hours. The options Jonathan featured for his audience that day went up by over 10x!
As of today, the replay of Wednesday’s event is still available. At the end is the chance to join Jonathan as a charter member of his Advanced Notice service and save 60%, as long as we hear from you by tomorrow, May 15.
Watch now and see this 25-year veteran trader in action, including a recent win streak that could have turned $2,500 in each of his seven (straight!) winning trades into more than $21,000 in profits in just six weeks.