
Here’s What Seasonality Says about September into Year End
With a rough-and-tumble August behind us, the markets are looking forward to clearer skies as we enter the autumn months – with lower interest rates to go with the lower temperatures, courtesy of the Federal Reserve. But I wouldn’t get too comfortable yet: this season might not be smooth sailing.
Here’s a favorite quote of mine on the subject, from Mark Twain’s Pudd’nhead Wilson:
“October. This is one of the peculiarly dangerous months to speculate in stocks. The others are July, January, September, April, November, May, March, June, December, August, and February.”
Sam Clemens wrote that way back in 1894, after a string of bad investments left the now-legendary author bankrupt – many years before the Great Crash of October 1929, and way before the Black Monday crash of October 1987, which I still remember well. The quote stuck around, too: now we call the tendency for stocks to drop in October the “Mark Twain effect.”
And in practice, Twain had it almost right. If he were still writing today, he might say this instead:
“Welcome to September: The most dangerous month of the year for stocks.”
Leaves – and Stock Prices – Fall in Autumn
September has a well-deserved reputation for producing negative stock returns. As you can see below, since 1928 this month has produced average negative returns of 1.17% – that’s over the past 96 years:
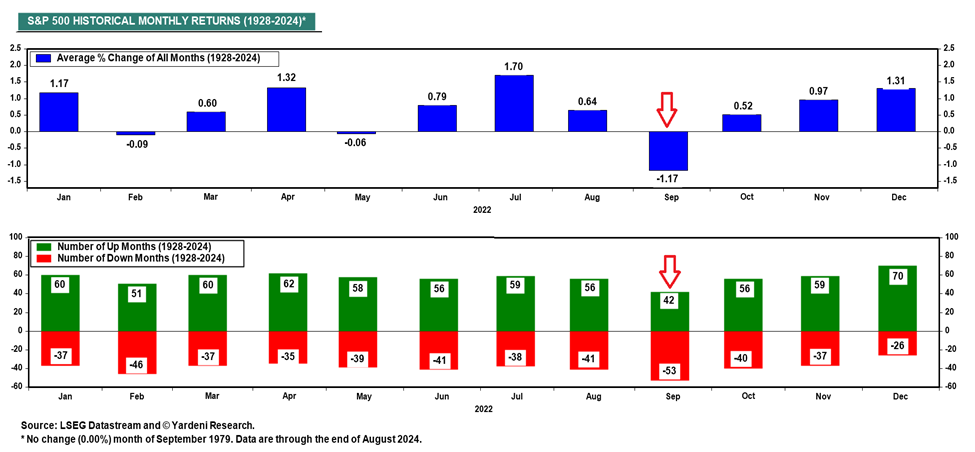
The only other historically-negative months for the market are May (with average returns of -0.09%) and February (averaging -0.06%). And these two months don’t even come close to September’s penchant for inflicting pain on investors. In fact, September has been particularly dangerous over the past four years. Here’s how it’s affected the S&P 500 recently:
- 2023: S&P 500 down 5%
- 2022: S&P 500 down 9%
- 2021: S&P 500 down 5%
- 2020: S&P 500 down 4%
That’s an average loss of 5.75% for each September since 2020. The most dangerous month indeed! Perhaps this year will break the losing streak… but don’t count on it.
But there’s no reason to panic – and no need to blindly guess at what’s coming up for the market. Instead, to see what may be in store for the month ahead and into year end, let’s consult TradeSmith’s Trade Cycles tools and see what the hard data says about the future.
From your TradeSmith Finance dashboard, simply click on Markets from the main menu, then select the S&P 500 (SPX) from the list of options on the Market Outlook tab – or any of the other indexes listed, if you wish. Next, click on the Trade Cycles tab in the Stock Analyzer.
If you don’t see this tool in your TradeSmith Finance platform – and you’d like to – give us a call at 888-623-0858.
Looking Ahead with Trade Cycles
Here’s our standard cycle chart for the S&P 500, which includes historical cycles of various lengths from short- to very long term:
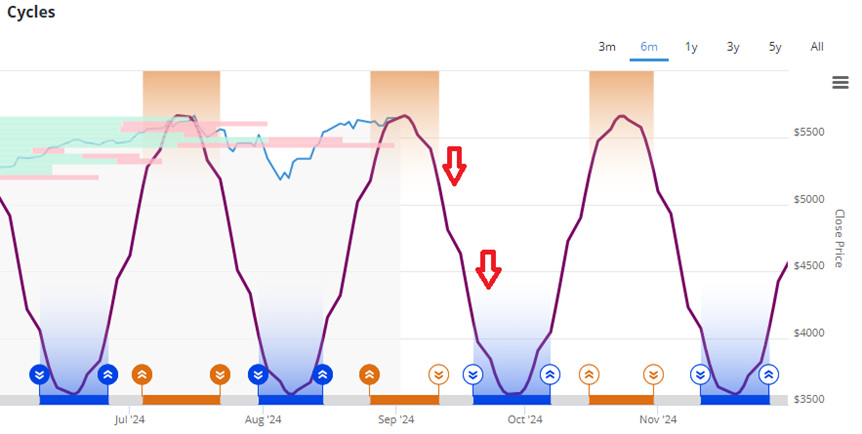
The blue line in the chart above is the current price trend of the S&P 500. The purple line traces out the potential short-term cycle into the end of the year. Looking at both lines, you can see that we reach a short-term cycle peak this week – which starts a downtrend that doesn’t bottom out until the last week of September.
Reviewing different cycle lengths in this tab will give you a similar – but different – view. For instance, the middle-term cycle (not shown) trends higher into late September but then peaks in October.
That lines up closely with the next peak in the short-term cycle as well. And when more than one cycle converges like this, it increases the conviction level for the pattern. In this case, the pattern shows the market down during the second half of October.
Now, let’s dig even deeper and see what our Seasonality charts say about September through year-end. By clicking the gear icon, we can even check seasonality across election years – like 2024 – specifically:
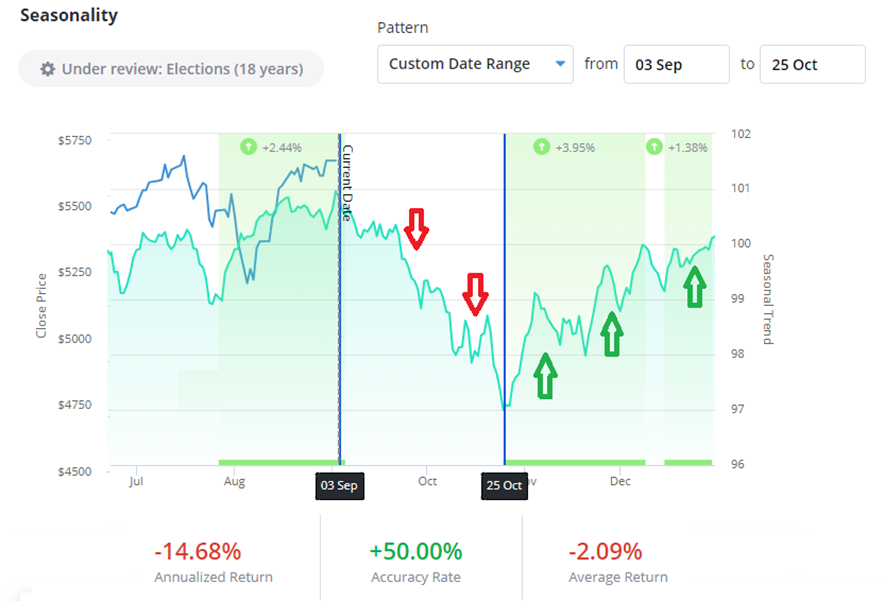
I selected a custom date range of today through late October, which overlaps perfectly with our traditional cycle chart shown previously.
You can see that from a seasonal perspective, election years have averaged a negative return of 2.09% over this period (that’s -14.68% annualized). And the period has seen the S&P 500’s prices decline half the time.
The good news, as you can see at far right of the seasonal chart, is that stocks tend to rally into year-end, up nearly 5% on average over the last 18 election years.
Mike Burnick’s Bottom Line: The stock market’s recent troubles may not be over yet. This is an election year, after all, and an unusual one at that. Our historical Cycle and Seasonality studies suggest more downside is possible over the next two months, as we get closer to the U.S. presidential election. But after that, get set for a good buying opportunity moving into year-end.
Good investing,
Mike Burnick
Senior Analyst, TradeSmith
P.S. TradeSmith’s seasonality and market-cycle analysis tools give you a powerful future forecast for the financial markets. And you can tap into both of these valuable insights everyday with our Trade Cycles advisory, brought to you by TradeSmith analyst William McCanless.
You can see William’s latest Trade Cycles research for yourself right here and get what you need to help improve your timing on each trade, especially in these volatile autumn months.