How to Find Stocks that Can Buck September’s Seasonal Downtrend
The cycles found in nature – such as the seasons of the year, the phases of the moon – are an irresistible force. Every month, we’ll see a full moon. It’s a naturally repeating pattern, as reliable as the tides.
Financial markets follow cycles and seasonal influences, too.
For instance, the stock market has bullish seasonality from November through January. Perhaps not every single year, but historically this holds true more often than not.
September, however, just started – and historically, it’s the worst time of year for stocks, with bearish seasonality on the rise over the next two months.
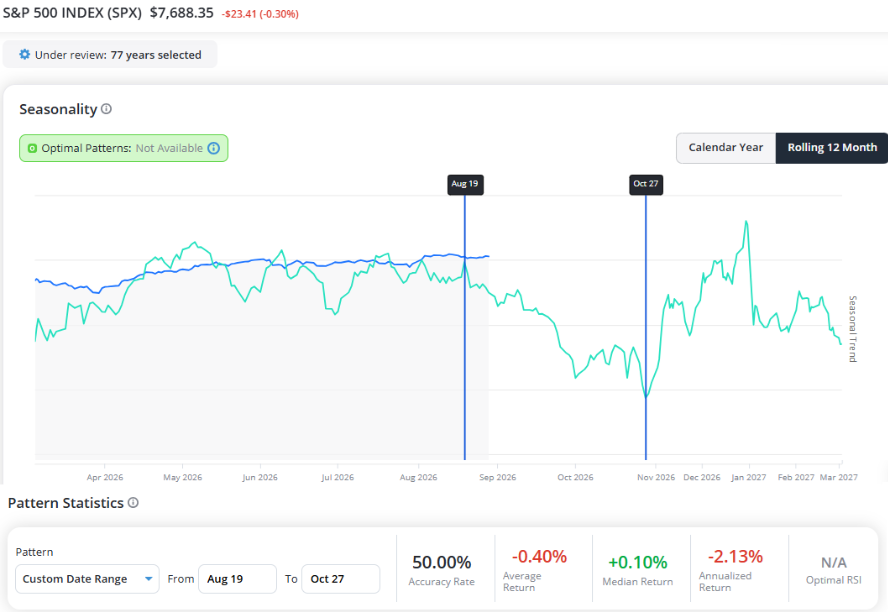
As you can see from the Trade Cycles chart above, S&P 500 stocks are up just 50% of the time from late August through October.
That’s no better than the odds of a coin flip.
In fact, the S&P 500 has delivered a negative annualized return of -2.1% during this time frame over the past 75 years.
Again, bearish seasonality doesn’t show up every year. Last September, the S&P 500 gained 3.5%. That’s why you should use seasonal patterns as a guide but not take it as gospel.
Still, over the long run, September’s losses have outpaced its gains. But that doesn’t mean everything heads south this time of year.
With our Trade Cycles Calendar, you can spot stocks that can buck this seasonal downtrend for stocks.
TradeSmith subscribers can access this valuable seasonal data by clicking on More from the main menu bar, then Calendar.
This lands you on our Market Calendar page, which tracks upcoming market events, including earnings, stock splits, dividend dates, and much more.
Next to Market Calendar, click on Trade Cycles Calendar to view …
Please Note: If you don’t see this in your TradeSmith Finance dashboard, and would like to, please call our dedicated Customer Care team at 866-220-1107 to find out how to get access.
Seasonal Trends by the Calendar
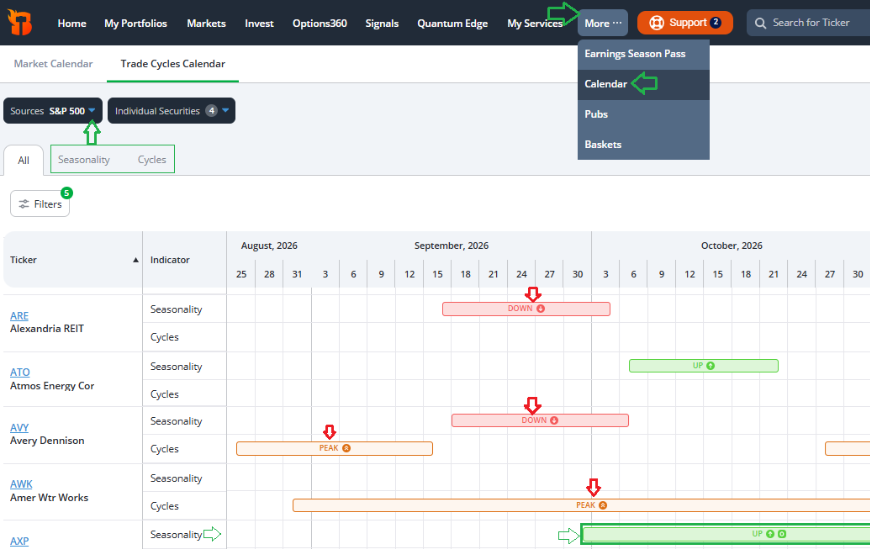
From here, you can explore seasonal windows for stocks across the market – and filter for especially consistent windows with just a few clicks.
From the Sources menu, I selected the S&P 500 stock basket.
Next, click the Filters button to set our desired filters for our seasonality search.
To find stocks positioned to weather this seasonal weakness, I used our Trade Cycles filters to screen for S&P 500 stocks with:
- Bullish seasonal patterns over the last 15 years…
- And stocks in a Valley Cycle with medium, high, or very high conviction levels.
Simply click the green Apply Filters button to view your results in the Calendar:
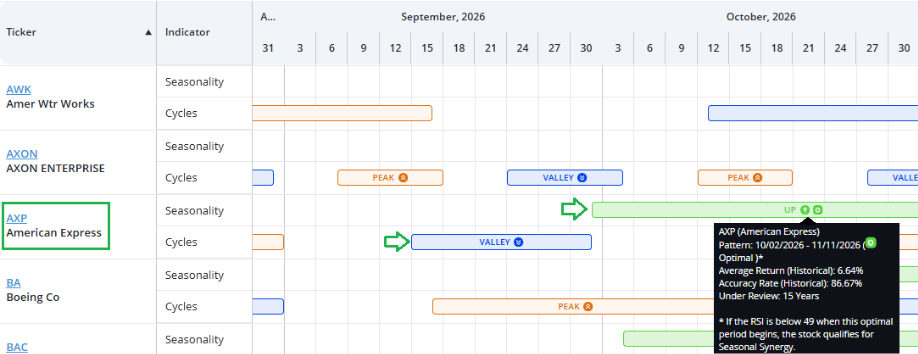
As you scroll down through the list of S&P 500 stocks in the Calendar view, most are at or near Cycle Peaks – exactly what you would expect into seasonal weakness.
But there are stocks that stand out as bullish, even in this typically bearish time of year.
For instance, American Express (AXP), shown above, is in a Valley upturn area now, with an Optimal Seasonal pattern starting Oct. 2.
Optimal Seasonal patterns carry a higher level of reliability, with at least 80% historical pattern accuracy based on 15 years of trading history.
AXP, for example, is up 86.6% of the time historically, posting average gains of 6.64% during this period over the past 15 years!
Screen for a Triple Check of Upside Potential
TradeSmith members can dig deeper by using our Screener tool to find stocks like AXP with seasonal uptrends in the months ahead.
Click on Invest from the main menu, then Screener. Next, click the + Add Filters button. Here are the filters I chose for this screener:
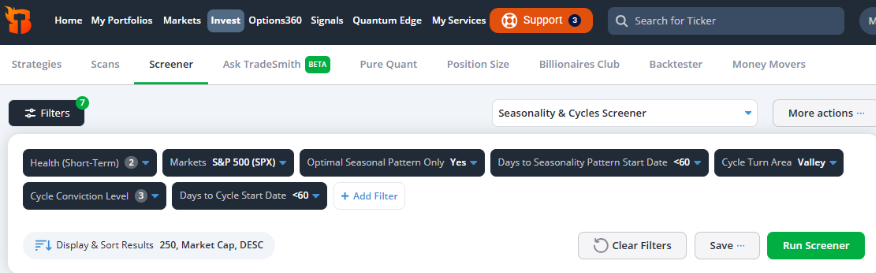
- Health (short-term) green
- Markets: S&P 500
- And from our Trade Cycles filter category
- Optimal Seasonal Pattern Only, and select Yes
- Days to Seasonality Pattern Start Date, less than 60
- Cycle Turn Area, select Valley
- Cycle Conviction Level, Medium, High, and Very High
- Days to Cycle Start Date, also less than 60
This filters for healthy S&P 500 stocks with Optimal Seasonal patterns that are also in or near a Cycle Valley area with these stocks expected to turn higher.
When I ran this screener yesterday, I got 95 results – plenty of stocks with potential to buck the seasonal downtrend. Below are the top 10 results.
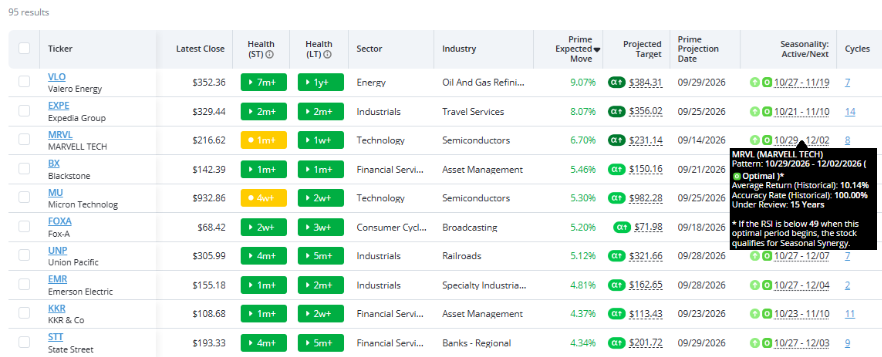
I also added our Predictive Alpha columns to the results and sorted by Prime Expected Move.
Predictive Alpha generates 21 daily price projections for every stock we track, using AI-driven analysis to build a unique model for each stock based on its own patterns and current market behavior.
Sorting by the Prime Expected Move puts the stocks with the highest projected price increase over the next 21 trading days at the top of the list.
With these simple filters, I can easily do a triple-check for upside potential:
- Optimal Bullish Seasonal patterns…
- Cycle Valley upturn potential, according to Trade Cycles indicators…
- And bullish price projections, according to Predictive Alpha.
Mike Burnick’s Bottom Line: Our Calendar view is a great way to keep track of upcoming events like earnings or dividend dates. And with the Trade Cycles Calendar, you can anticipate cyclical and seasonal uptrends – or downtrends – in stocks you follow. Take it a step further by filtering your portfolio or other watchlists for seasonal and cyclical trends using TradeSmith Screener.
Good Investing,
Mike Burnick
Senior Analyst, TradeSmith
P.S. Timing your entry to stocks doesn’t end with the S&P 500’s broad seasonal cycles.
My colleague William McCanless, the analyst at Trade Cycles, has taken the idea down to the individual stock – pinpointing the specific “green day” windows when America’s biggest names have historically rallied the hardest.
The patterns are strikingly precise. Looking back over the past 15 years, William has found windows where blue-chip stocks climbed 80% or more of the time – like Amazon between April 8 and May 6, or Google between Jan. 6 and Feb. 3. Each setup tells you exactly which day to buy, which day to sell, and how long the window has historically lasted.
Click here to see which stocks are entering their green-day windows now.