
How to Overcome Brand-Name Bias and Size Up Stocks with the Facts
Apple recently surpassed Microsoft to become the largest company by market cap, and for good reason.
The stock has returned an astounding 719% in the past decade and 34,000% in the last 20 years!
Apple (AAPL) is also currently the worst growth stock out of the Magnificent 7, which includes Alphabet (GOOGL), Amazon.com (AMZN), Meta Platforms (META), Microsoft (MSFT), Nvidia (NVDA), and Tesla (TSLA).
I know that sounds a bit harsh. But it’s the truth.
Trailing 12-month sales have been essentially flat since the first quarter of 2022.
They’ve grown at an annual rate of 8.3% over the past five years, but that’s dropped to just 3.6% over the last three years.
For a company that’s widely considered a top growth stock, that’s very little growth. Yet, the stock has risen 10% year-to-date and over 300% in the past five years.
Look, I’m not saying that Apple is a bad company or that its best days are behind it. I personally believe it’s a “cult” stock, but that topic will have to wait for another day.
I’m simply pointing out that you can’t let the high-caliber brand name of a company bias your objective appraisal of the true value of a stock.
Today, we’re going to learn how to use TradeSmith’s tools to avoid brand bias and instead focus on quality.
What’s So Magnificent about the 7?
“The Magnificent 7” is a reference to a 1960 Western, an old favorite flick of mine.
In 2023, Bank of America analyst Michael Hartnett borrowed the term for the seven companies recognized for their market dominance, technological impact, and changes to consumer behavior.
That’s all fine and well. But investable opportunities need more than just a sexy story.
Otherwise, your portfolio could end up stuck holding a Peloton or Zoom Video once the honeymoon’s over.
The latest market gyrations and earnings results give us the perfect opportunity to analyze the Magnificent 7 stocks.
We’ll evaluate the group using technical, fundamental, and valuation measures. But first, let’s gather the data using TradeSmith.
One Convenient Source
I started by building a watch portfolio of the seven stocks so we can quickly compare them across different measures.
First, I logged in to TradeSmith Finance and clicked on My Portfolio in the main menu bar at the top. Then I clicked on the Manage tab, and the green + Add Portfolio button.
This will be a Manual and Watch Only portfolio, and I just entered each ticker symbol and clicked the green Save Portfolio button.
From there, I added some basic technical indicators, including our TradeSmith Health Indicator and Smart Moving Average Trend rating. Then I added Jason Bodner’s Technical Score.
To add these and the other indicators, go to the right side of the portfolio listing and click the View down arrow, then click on + Add View.
A large dialog box will open and you’ll be able to select and deselect any indicators you’d like (and that you subscribe to). You can also add a View Name and click on the green Save button to revisit this particular view. For space reasons, this is only a portion of all the view options.
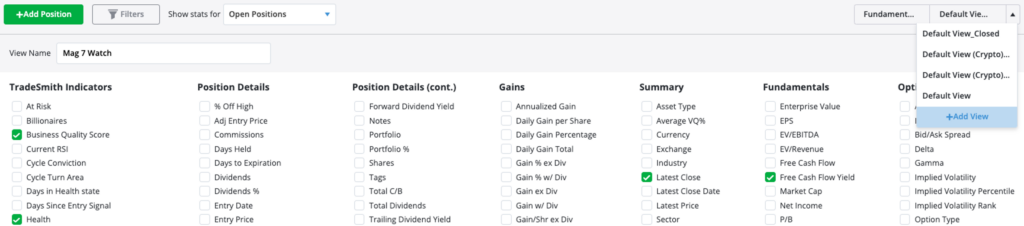
As a reminder, I have access to TradeSmith Platinum and every feature and indicator. If your view options don’t include the tools I mentioned here, and you would like to add them, call 888-623-0858 to discuss.
Technically Speaking
Getting back to the Magnificent 7, very quickly I can see that the latest market pullback has been rough on these stocks, with the 7 declining more than 20% collectively.
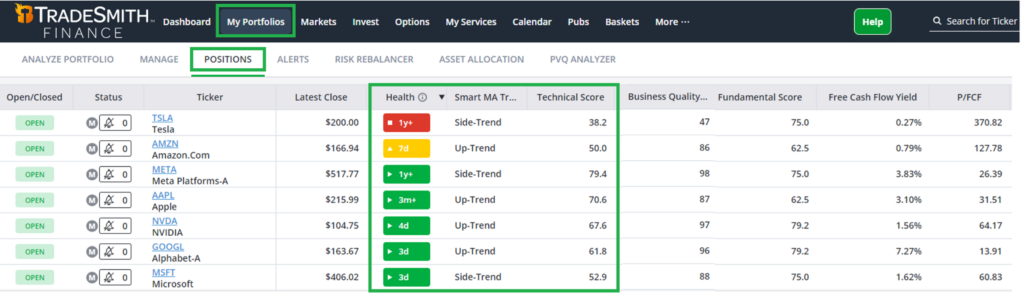
Several have pulled back, and Amazon has slipped into the Yellow Zone.
That’s still considered healthy, but it means Amazon shares are more than halfway to being stopped out in the Red Zone.
Meanwhile, Tesla has been mired in the Red Zone for nearly two years now and is in a side-trend. Meta has been in the Green Zone for just over a year, but it’s also in a side-trend, as is Microsoft.
That leaves only Google, Apple, and Nvidia in both the Green Zone and an uptrend.
Apple has been in the Green Zone for only three months. Nvidia, Google, and Microsoft have been back in the Green Zone for just a matter of days after they dipped into the Yellow Zone recently.
When I looked at Jason’s technical scores, I saw something unusual.
Despite Apple sitting in the Green Zone, its score is just 70.6, average at best. Technical scores for Google and Microsoft aren’t much better at 61.8 and 52.9, respectively. And Tesla’s score is a lowly 38.2!
What stands out is that Meta’s technical score, at 79.4, is head and shoulders above the rest.
With this information, let’s turn to a fundamental review for each company.
Fundamental Foundations
Here, I want to take a closer look at the TradeSmith Business Quality Score (BQS) and Jason Bodner’s Fundamental Score.
Looking at the BQS, we find that Meta, Nvidia, and Google come out on top with scores in the 90s. Microsoft, Apple, and Amazon are next with scores in the 80s. Tesla is dead last again, with just a 47 BQS.
Jason’s own fundamental score tells a somewhat different tale.
Google, Nvidia, Meta, and Microsoft all score well at 75 and 79.2. Even Tesla rates a 75. But Amazon’s and Apple’s fundamental scores look inferior to the others, each scoring just 62.5.
Finally, let’s take a closer look at valuation to see how much we would have to pay for each of the Magnificent 7.
“Price is what you pay. Value is what you get.”
That quote from Warren Buffett says it all. You can find a remarkable business with excellent growth prospects, but just be careful about what you’re paying for that excellence.
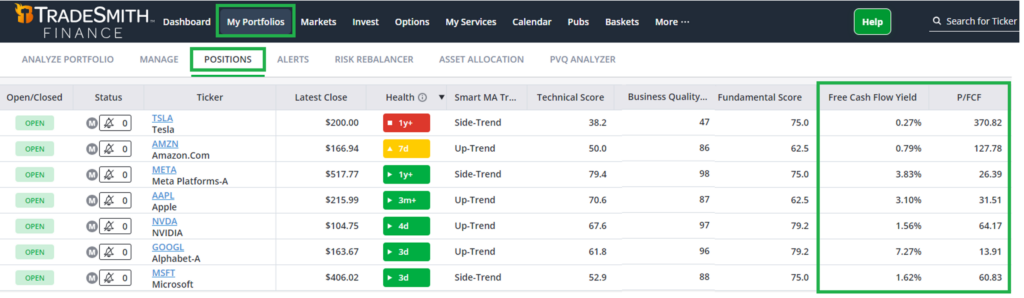
Here I’m looking at what is perhaps one of the single-best metrics for measuring quality and valuation: free cash flow yield (FCF%).
Like dividend yield, it’s expressed as a percent and higher is better. But in this case, you compare the last 12 months of FCF not to price, but to the stock’s enterprise value, which is equity value plus debt. That’s a higher hurdle than stock price alone.
Research has shown that FCF% is the single-best determinant of a stock’s performance, better even than the more popular price-to-earnings ratio (P/E).
That’s because earnings per share can be (and too often are) manipulated by public companies. But free cash is where the rubber meets the road. It’s the actual cash earned by a business after expenses and capital investments. What’s interesting is only Google has an above-average FCF% of 7.27%. Meta and Apple are good at 3.83 and 3.1, respectively, but not great.
The rest of the Magnificent 7 score below average in this key metric with, not surprisingly, Tesla at the bottom.
Adding up the various metrics for Tesla, if the stock were an Olympic athlete, it would have never won a medal at the Paris games, and likewise scores too poorly for me to consider.
Going back to the TradeSmith Finance portfolio image above, next to FCF% is price to free cash flow (P/FCF), which is simply the reciprocal of the free cash flow yield. It’s expressed similar to the P/E ratio, where lower is better when you’re looking to buy a stock.
No surprise that Google, with the highest FCF%, also has the lowest P/FCF at just 13.91. In my book, that looks like a bargain for an accomplished growth stock.
Meta and Apple both score reasonably well on this metric at 26.39 and 31.51, respectively. But at the top we discussed Apple’s lack of growth.
And paying 31x free cash flow for a company with single-digit growth rate looks expensive to me.
Meanwhile, Microsoft and Nvidia look fully priced at over 60x FCF. Amazon looks a bit pricey at 127x, and Tesla… forget about it.
Think about P/FCF this way. As a buyer of Tesla, you are paying 370x its annual free cash flow. In other words, it would take you 370 years to recoup your per-share investment if the cash flow remains constant.
Of course, Tesla free cash flow could grow even faster, but it would have to literally go bonkers to grow into this valuation premium. And perhaps it will, but I’m not willing to bet on it.
Diving Deeper
This is meant as a quick comparison of these companies. You can do the same with any group of stocks as long as they’re in a similar sector.
But to get more detailed information on each stock, simply click on the hyperlinked ticker symbol for each stock in the portfolio to get more data.
After my analysis, Google looks to me like a clear gold medalist, while Meta is close behind with the silver. You could consider it a tie between the two, but valuation gives Google a slight edge in my book.
And the bronze medal goes to … let’s make it a contest. Send me an email at [email protected] to let me know which of the remaining Fab 5 should win the bronze and why.
Mike Burnick’s Bottom Line: The TradeSmith Finance platform makes it super easy to make direct, side-by-side comparisons between similar stocks. Using a combination of fundamental, technical and valuation factors can help you quickly zero in on the champion stocks for further research.
Good investing,
Mike Burnick
Senior Analyst, TradeSmith