How to Skate Into the Best Potential Sectors Using TradeSmith Seasonality
| Editor’s Note: TradeSmith offices, including Customer Success, are closed this Thursday and Friday for Independence Day. Inside TradeSmith will be back next week. |
Welcome to July! The year is now half over, and what a first half it has been for the stock market.
The S&P 500 Index (SPX) gained 15.3% during the first half of 2024. That’s the good news.
The bad news is that only two out of the 11 S&P sectors managed to beat the index performance over the last six months.
Those sectors are, no surprise, technology and communications services. And don’t forget, the latter sector includes Facebook-parent Meta Platforms (META), Google-parent Alphabet (GOOG), and Netflix (NFLX) – all mega-cap favorites.
The next-best sectors in terms of first-half performance are energy (10.4%) and financials (10.2%), and SPX beat both by about 5%. The only sector to decline year-to-date is real estate (2.5%).
So, the stock market’s performance continues to be extremely top-heavy.
You can see this disparity most clearly in the performance of the S&P 500 Equal Weight Index (EWI), where every stock’s performance counts the same. It was up less than 5% in the first half of 2024, lagging the regular, cap-weighted S&P by more than 10%.
For the second quarter alone (April to June), SPX was up 3.9%, compared with a 3% decline for EWI. And just three stocks – Nvidia (NVDA), Alphabet, and Apple (AAPL) – accounted for ALL of the SPX gains and then some.
While it may seem irrational that so few stocks account for so much of the S&P 500 Index performance, remember that markets can stay irrational longer than you think (and longer than you can stay solvent if you try to “outsmart” them).
Therefore, big tech stocks may continue leading the market higher in the second half. Or maybe not.
In Hockey and In Business
I’m a big hockey fan, and I’m just returning to “normal” after celebrating the Florida Panthers’ first Stanley Cup victory. Even though their victory parade in Fort Lauderdale last weekend was nearly rained out, it didn’t dampen my enthusiasm one bit.
One of my favorite hockey expressions is from the Great One, Wayne Gretzky, who famously said “I skate to where the puck is going to be, not where it has been.”
In the investment business, it’s the same way. You can score much better returns if you correctly anticipate where the stock market is going, rather than assuming it’ll keep doing what it did in the past six months.
With that in mind, in today’s column I want to share with you a simple screen that uses our Seasonality and Money Movers tools to help you anticipate which market sectors could score the biggest gains going forward. So, let’s dive right in.
Note, you’ll need a subscription to Trade Cycles by TradeSmith, TradeSmith Essentials, or TradeSmith Platinum to access our Seasonality and Money Movers tools. If you don’t see these options in your TradeSmith Finance dashboard — and would like to — call 888-623-0858 to discuss.
I wrote recently about the Trade Cycles Seasonality tools here, and you can find more on Money Movers here. But to quickly recap:
Seasonality allows you to prospect for bullish or bearish seasonal trading windows throughout the calendar year. I’ll focus on those seasonal periods with a high accuracy rate.
Money Movers is our proprietary multi-factor algorithm that helps you identify which sectors and stocks the institutional traders, investment banks, and billionaires are moving in and out of. The factors we use include:
- Institutional & Insider Buying or Selling
- On Balance Volume
- Smart Money Index
- Money Flow Index
Click here to read more about our unique Money Movers indicator.
In this screen, I’ll focus the search on ETFs because they represent entire sectors or industry groups. But this same screen can easily be applied to individual stocks as well.
Let’s set up our screen by clicking on Invest from the main dashboard menu, then clicking on Screener from the tab menu below. Next, click on the + Create New Screener button, then + Manage Filters at the top right to open and select the following filter options.
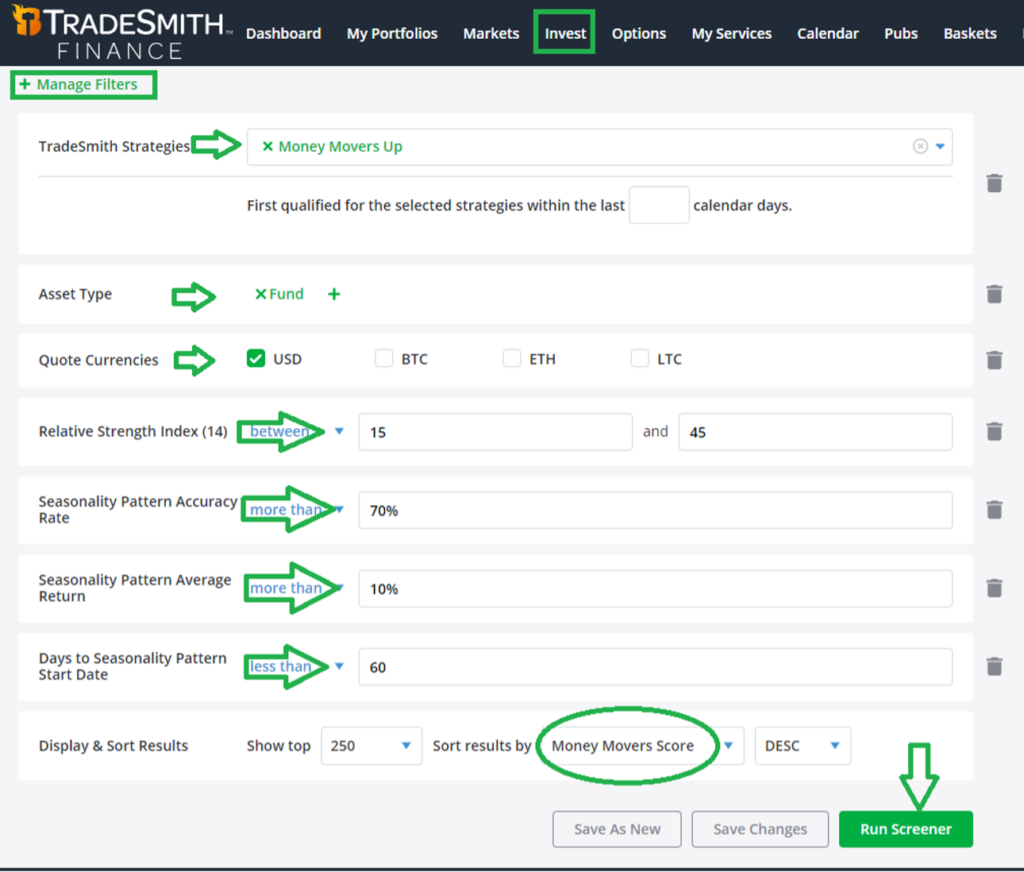
From the top, these filters are:
- TradeSmith Strategies: Money Movers Up
- Asset Type: Fund, which includes ETFs.
- Quote Currency: US Dollar, so we limit to only domestic funds.
- Relative Strength Index: Between 15 and 45, to filter out overbought funds.
- Seasonality Pattern Accuracy Rate: more than 70% (this gives us the most accurate seasonality)
- Seasonality Pattern Average Return: more than 10%
- Days to Seasonality Pattern Start Date: less than 60 days, or the next two months
You can also loosen or tighten any of these Seasonality filters to get more or fewer results if you choose. Once you’ve made all your filter selections, click the Run Screener button at the bottom right to get your results. Here’s a partial list below.
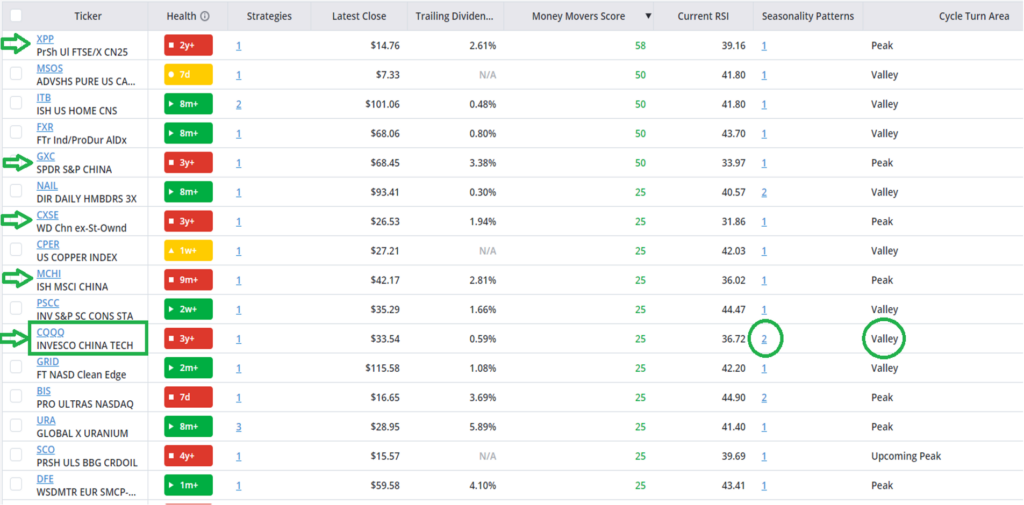
Again, the idea here is to find ETFs that could become the next sector leaders. That’s because they’re currently not overbought (unlike tech) but have high Money Movers scores, meaning big-money buyers (billionaires, institutional investors, and insiders) appear to be accumulating these ETFs. Plus, they have bullish seasonal trading windows coming up within the next two months.
One Surprise ETF in the Mix
Interestingly, China stock ETFs show up multiple times on this list, marked by green arrows above. Chinese stocks have been lagging the S&P 500 for some time. But in April and May, they outperformed the S&P 500 (10% to 3.8%) before pulling back in June.
In fact, five of the top 11 results sorted by our Money Movers score are China stock ETFs. One in particular that caught my eye, highlighted above, is Invesco China Technology ETF (CQQQ). For the U.S. markets, we have the Invesco QQQ ETF (QQQ) that tracks the Nasdaq 100 Index, including the Magnificent 7 stocks; CQQQ is the Chinese version of that.
Simply click on the highlighted number in the Seasonality Patterns column (above image) to see the details (below image).
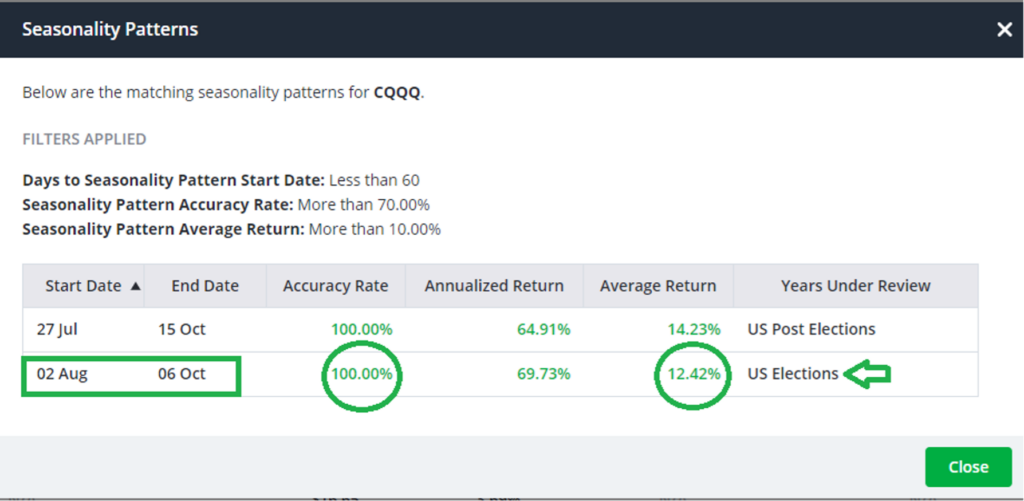
- The Seasonal Pattern during U.S. Election years runs Aug. 2 to Oct. 6
- It has a pattern accuracy rate of 100%
- And it has posted average returns of 12.42% during this time frame
As a bonus, CQQQ is also in a Valley turn area according to our cycle-timing indicators. Perhaps this is telling us that China ETFs are where the puck will be about one month from now.
Mike Burnick’s Bottom Line: Our unique Seasonality tools work just as well for spotting ETF buying opportunities as they do for individual stocks. And this Seasonality Screener can help you identify ETFs that already have positive money flows and a bullish seasonal tailwind just ahead.
Good investing,
Mike Burnick
Senior Analyst, TradeSmith
P.S. Now, here’s more on Gretzky the Great. He’s also quoted as saying: “You miss 100% of the shots you don’t take.” Of course that applies to investing as well. Don’t pass up a good trade opportunity, even if it doesn’t score. I wonder if the Great One has an inner investment adviser trying to get out.
And if you’re trying to skate past all the noise of the now-crowded AI trade, let me tell you about another Great One: Louis Navellier.
Louis recently sat down for a presentation about his Breakthrough Stocks advisory, which he has used to uncover 18 100-baggers in his career – stocks that multiply your money by 100x or more. And that’s on top of almost 700 other stocks he found that doubled.