
How to Stack the Odds of Options Success in Your Favor
Options contracts are often called an “insurance policy” for investors. So, it’s worth asking: How do insurance companies make (so much) money?
First, they employ statisticians called actuaries who perform sophisticated mathematics to price their products.
Then, these number crunchers ensure the company charges a high enough premium on the policy so that on average, they make money across hundreds of thousands of customers, even if they have to pay out some claims.
Actuaries, of course, can’t predict the future. So, just like any of us would, they forecast the best they can with history as their guide. Based on as much historical data as they have available, they come up with statistical models that predict the likely outcomes based on certain inputs. And this is also how options markets work.
The price you pay for an option comes down to five key components:
- Demand (or implied volatility) for the option
- Time until expiration
- The distance between the underlying asset’s price and the option strike price
- Interest rates
- Dividends
With this information, anyone can calculate the probability of different events occurring. That’s pretty powerful stuff.
And you can quickly and easily apply this analysis to any stock option using our unique TradeSmith Probability of Profit (POP) Calculator tool as an Options360 subscriber.
Here are the data inputs:
- Ticker symbol
- Future date (the event date you are testing)
- Implied Volatility
- Interest rate (the 3-month T-Bill rate annualized or 1-year Treasury rate works)
- Trailing Dividend Yield
- Highest Target Price
- Lowest Target Price
The best way to explain how to use this powerful tool is through an example.
How to Place High-Probability Bets with TradeSmith Options Tools
Apple (AAPL) stock is trading near $190. Lately, there’s been a lot of bullish momentum behind the stock, with analyst upgrades and raised price targets.
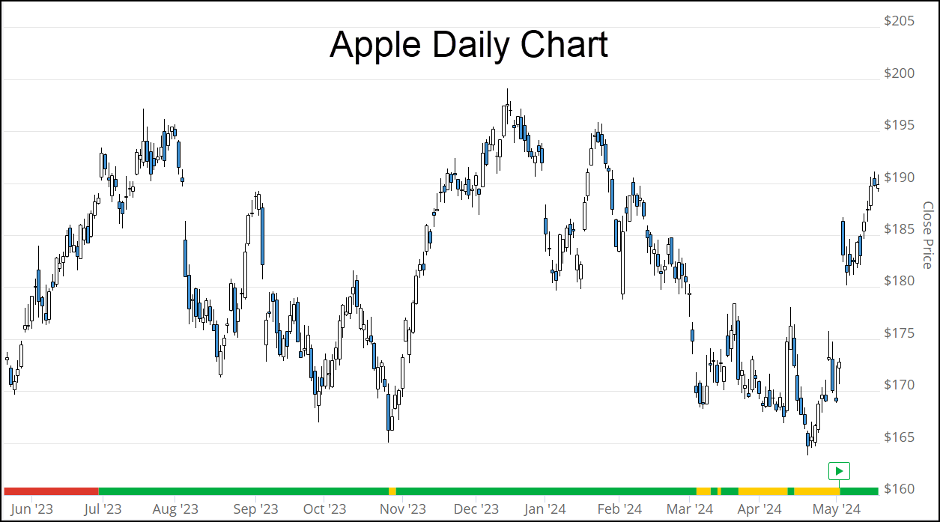
Let’s say that before the recent pop in AAPL stock, you bought the $200 call option that expires on July 19 for just $0.75.
And right now, that option is worth $1.50: already a double. Nice work!
But now you’re trying to decide whether to grab the profit or let it ride until expiration. Giving the trade more time could mean more upside, but you risk giving up the open gains you’ve already earned.
So, you need to know the probability of the stock being at least the $200 strike price by July 19, or even higher, say $210, so you could bank more profits.
That’s all the information you need to use our POP Calculator and see your future odds of success if you were to keep holding the AAPL call option. Note these tools are available to subscribers of our Options360 product, as well as TradeSmith Essentials and TradeSmith Platinum. If you don’t see these options in your TradeSmith Finance dashboard — and would like to — call 888-623-0858 to discuss.
Here’s a screenshot of the POP Calculator with all the data:
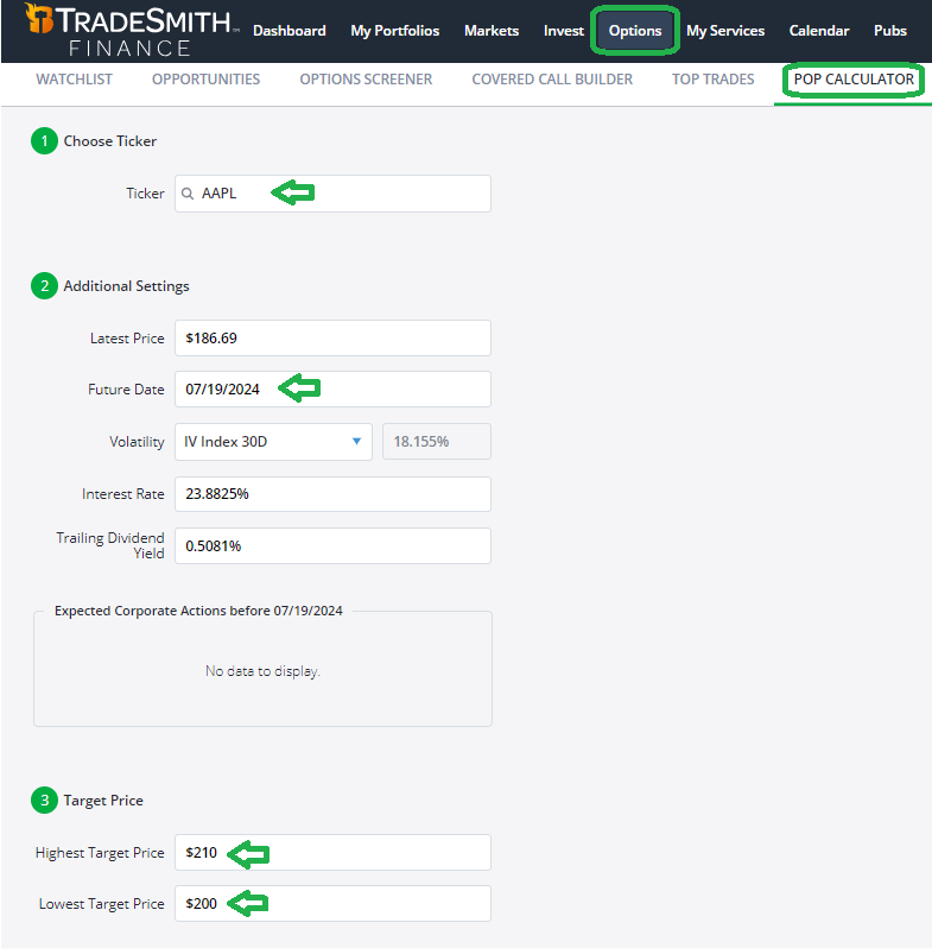
1. Choose Ticker
- Simply enter AAPL.
2. Additional Settings
- Our database populates the Latest Price of AAPL for you: $186.69.
- Select your Future Date from the dropdown calendar window: July 19.
- Our system finds the 30-day Implied Volatility (IV) for you and populates it. In this case: 18.15%.
- Note, you can also click on the dropdown box and select Historical Volatility (HV) and different time periods for both implied and historical volatility.
- The interest rate and trailing dividend yield for AAPL are also populated for you.
3. Target Price.
- Enter the target price range you want to calculate probabilities for. In this case, $210 is our Highest Target Price, and $200 is the Lowest Target Price.
- Now click on Calculate.
The Options360 POP Calculator gives you all the key data to help you make a well-informed decision about your trade: sell and grab the gains or let it ride. Here are the results for the AAPL example.
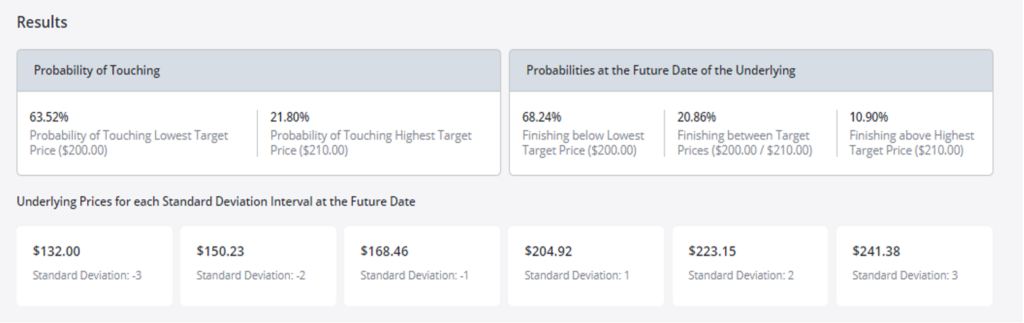
In the first row at left, you can see the Probability of Touching the $200 strike price is 63.52%.
The problem for our $200 strike call option is that it might not hold that level through expiration.
At right for the Probabilities at the Future Date you selected, you’ll see that the stock will finish:
- Below the Lowest Target Price: in this case, 68.24%
- Between the Target Prices: 20.86%
- And above the Highest Target Price: 10.9%
Just on the face of it, you can see these odds don’t favor holding AAPL call options until expiration. After all, there’s roughly a two-thirds chance AAPL trades below the $200 target price by expiration.
The second row of data calculates the most likely underlying price of AAPL stock at 1, 2, and 3 Standard Deviation Intervals for your future date. Here’s a simple illustration:
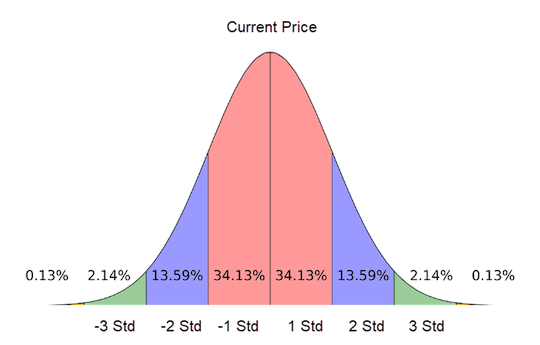
With the current price as the high point on this curve, the further away you get, the lower the probability of AAPL reaching that price.
- A +/- 1 standard-deviation move is statistically considered the most likely outcome, with a 68% probability (+34.13% chance AAPL is up, and -34.13% that it’s down).
- A +/- 2 standard-deviation move is less likely: odds of just about 27% that the price will reach either level by expiration.
- A +/- 3 standard-deviation move is very unlikely, with the probability of such a big move in either direction at just over 4%.
All this talk of standard deviations reminds me of the famous Mark Twain quote: “There are three kinds of lies: lies, damned lies, and statistics.”
Again, we can’t predict the future, but we have to make decisions about the future of our investments and trades anyway. So, referring back to the results in the table above, you can see that the most likely move (one standard deviation) puts AAPL stock in a price range between $168.46 and $204.92 by expiration.
The midpoint of that price forecast is $186.69, which is nearly 7% below the call option’s $200 strike price.
And the chances of a bigger (two or three) standard-deviation move are even more remote.
Given these low probabilities, it makes more sense to grab the profits now rather than risk it all for the slim odds of a bigger gain.
Mike Burnick’s Bottom Line: Our Options360 POP Calculator allows you to quickly measure the probability of a stock reaching a certain price by a particular date, so you can make more informed trading decisions. That’s a valuable tool in any trader’s arsenal, especially when you combine it with the other technical and fundamental indicators that you’ll find on the TradeSmith Finance platform.
Good investing,

Mike Burnick
Senior Analyst, TradeSmith