How to Use Seasonal Trends to Stay Ahead of the Market This Summer
Stocks have been zooming higher, pretty much in a straight line since the March low.
But now, seasonality may throw a monkey wrench into the market rally.
What Seasonal Trends Say About June
Let’s take a closer look at our Trade Cycles indicators to see where seasonal trends stand for the S&P 500 Index (SPX) in the first week of June. Our seasonal analysis identifies historical price patterns that tend to repeat at certain times of the year.
You can use this data to find high-probability periods for upside or downside moves in individual stocks or the stock market overall.
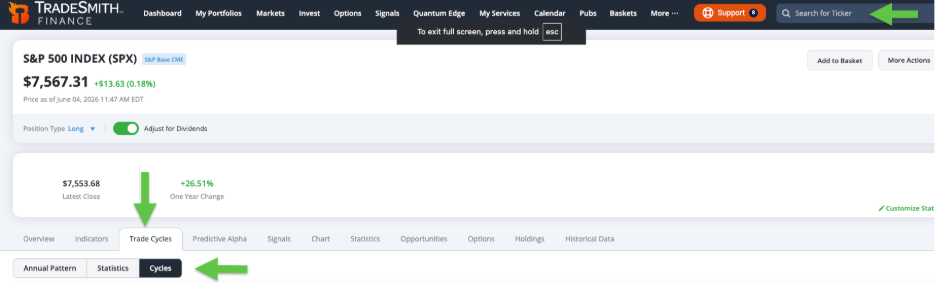
To access our exclusive Trade Cycles indicators, simply type in any symbol in the Search for Ticker box (above) – in this case SPX – then click the Trade Cycles tab.
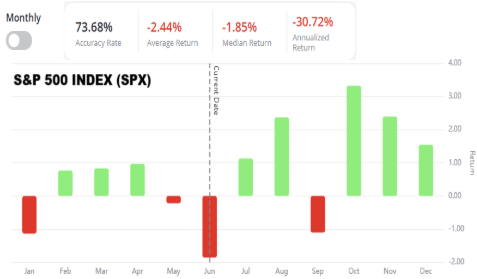
As you can see above, June has not been kind to SPX during midterm election years, and 2026 is one.
In fact, the S&P 500 has finished June higher in just five out of the last 19 midterm years since 1950, positive only about 25% of the time.
The average June loss is in mid-term years -2.4%, which, if annualized, adds up to negative 30.7%! Consistently bad.
The good news is that stocks typically enjoy a stronger seasonal rebound in July and August, as also shown above.
The month of June during midterm years also tends to show good initial gains in the first week, as shown below.
But that’s followed by a downside reversal in week two and lackluster returns in weeks three and four.
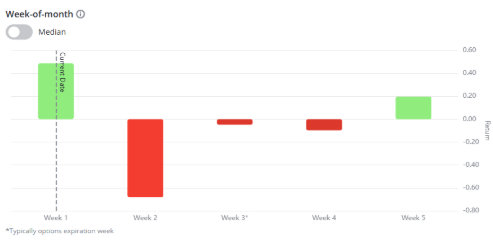
Those weeks typically surround monthly options expiration in June (June 18, specifcally), which is also a triple-witching event.
That means quarterly expiration for stock options, stock index futures, and stock index option all fall on the same day. That can make for a marked increase in volatility.
For context, the best June performance in a midterm year was +3.9% in 1998; the worst was -9.2% in 2002.
Before we continue, a quick reminder about next week’s webinar.
Your Next TradeSmith Walkthrough: Inside the Latest Tools and Opportunities
We’ve got plenty to cover in today’s issue – but there’s more to learn this coming week. Your next TradeSmith Walkthrough webinar is coming in just a few days.
Next Thursday, June 11, at 1:00 p.m. Eastern, join Senior Analyst Mike Burnick and the TradeSmith Education Team for an inside look at the latest enhancements across the TradeSmith platform. Mike will walk through new updates to Quantum Edge Pro and Signals, highlight the latest Screener updates, and demonstrate a practical screening strategy you can use to uncover real trading opportunities.
Be sure to stay for the live Q&A, where you can get your questions answered directly by Mike and the team.
Click here to register for Thursday’s webinar. We hope to see you there!
With that, back to our analysis.
What the Cycles Are Telling Us Now
Our proprietary Cycles indicators go beyond point-in-time seasonal trends.
To view these indicators from the Trade Cycles tab, simply click on the Cycles tab at the far right.
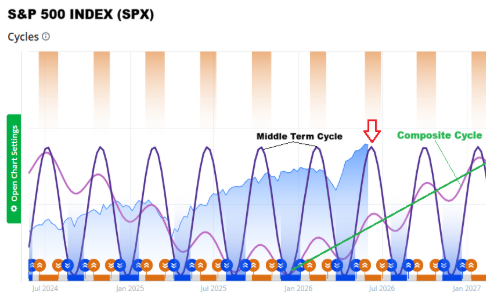
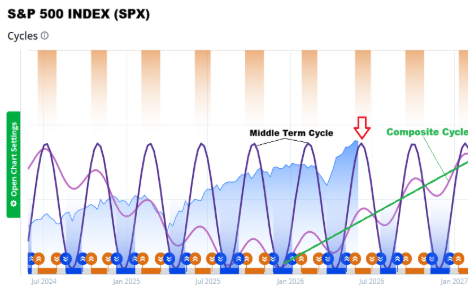
Peak and valley areas are highlighted on the Cycle chart above. These cycles tend to recur at regular intervals.
- Peaks (tops) are displayed in orange, indicating prices may move lower from here.
- Valleys (bottoms) are displayed in blue, which tells you price may move higher.
We classify and actively track various individual cycles of different lengths that tend to repeat consistently:
- Short-term: 20-40 trading days
- Middle-term: 41-100 trading days
- Long-term: 101-300 trading days
- Very long-term: 301+ trading days
In the chart below, notice how the Middle-Term Cycle shows an upcoming peak, and a valley downturn area is projected through early July.
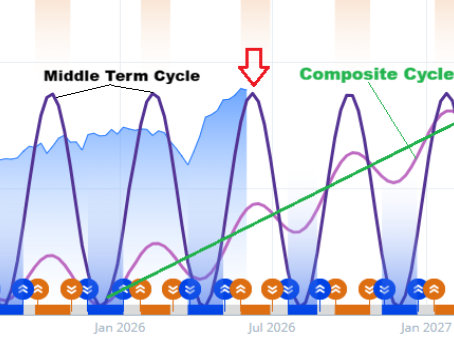
Also notice the Composite Cycle indicates a general uptrend through the second half of 2026.
The Composite Cycle is simply a combination of all the other individual cycles shown above – it represents the average expected trend.
And for S&P 500, that trend is up, with some middle-term downtrends in between.
Mike Burnick’s Bottom Line: Early June is showing a middle-term Seasonal and Cycle peak, and another Cycle peak is projected in September, which lines up with the typical seasonal weakness at that time of year. Overall, the S&P 500 trend looks higher into year-end, but with some pullbacks along the way. I frequently revisit our Trade Cycles page to help forecast upcoming shifts in trend, including high probability trading opportunities.
Good investing,

Mike Burnick
Senior Analyst, TradeSmith
P.S. The seasonal and cycle trends above tell us this summer will require the right tools and the right timing. Which is why what TradeSmith CEO Keith Kaplan is unveiling on June 10 couldn’t come at a better time.
Keith is stepping forward alongside investment legend Louis Navellier – who has a major new prediction you’ll want to hear. He believes it is the most important upgrade to the TradeSmith platform since its founding.
It’s a brand-new way to use AI that can potentially help you make 20 times more money, using the exact same stocks you already know and follow.
Our backtests show it could’ve turned a 292% gain on Broadcom into a 6,284% gain, and a 47% gain on Visa into a 263% gain. And it even has the potential to turn losing trades into big winners.
Given everything the cycle indicators are signaling now, this is the perfect time to level up.
Join Keith and Louis on June 10 at 10:00 a.m. Eastern. Click here to save your spot.