Ignore the Market Noise, But Pay Attention to These Signals
There are a lot of great investing books out there.
And there are some that aren’t so great.
One of the latter was published back in in 1973: A Random Walk Down Wall Street.
It argued that stock prices move randomly, making it difficult – if not impossible – to gain an edge over the market.
Even though it has sold over a million copies, I think it is baloney.
And after all I have seen in nearly 40 years of investing, I believe now more than ever that markets aren’t random.
Markets produce patterns that can be exploited for profit.
In the 1980s, an enigmatic mathematician named Jim Simons believed the same thing. He set out to confirm that there are valuable signals hidden in the supposedly random market noise.
And Simons proved it without a doubt.
Since 1988, his Medallion hedge fund delivered average annual returns of 66% by exploiting those often-hidden stock market patterns.
I mention this trip down memory lane because we’ve just launched one of the most powerful trading tools in TradeSmith history:
Signals by TradeSmith is a cutting-edge trading system that analyzes hundreds of stocks to uncover their hidden trading patterns you can turn into high probability profits!
Our Signals algorithms put hedge fund-level analytics at your fingertips. Every single trading day, Signals rigorously examines every stock in the S&P 500.
And just like Simons, it all starts with finding the right signals in the noise.
What’s a Signal?
A signal is simply a pattern.
Specifically, it’s a set of conditions that have shown up many times before in certain stocks – and when they did, the stock typically moved in a predictable direction more often than not.
The system runs through almost 200 possible entry rules and dozens of potential exit rules.
That adds up to more than two million potential trade assessments per day – or more than 500 million a year.
When certain conditions align, stocks have historically tended to move up or down in a consistent pattern.
Signals by TradeSmith flags those patterns so you can act on them with the odds stacked in your favor. It’s a valuable edge over the market.
One important thing to understand: A signal isn’t a prediction or a guarantee.
It’s a probability that tells you what has typically happened under similar conditions in the past – not what will definitely happen now.
From the vast universe of potential trade patterns, Signals narrows the list to a small number of trades that meet strict quality and consistency standards.
Those are the trade ideas we deliver to the new Signals dashboard every single day.
But don’t just take our word for it – the proof is in the performance.
In a six-year backtest, a model portfolio of Signals trades delivered a 12X return. And in 2022 – the worst year of stocks in half a century – they produced an average backtested gain of 16.6% while the S&P 500 fell nearly 20%.
And yesterday, TradeSmith’s CEO, Keith Kaplan, walked nearly 9,000 people through exactly how this works at the AI Signals Trading Event, with live trade examples, strategy details, and on-screen demos. If you missed it, the replay is still available.
Go here to watch it now and start trading with Signals.
Either way, here’s everything you need to know to use it with confidence – starting with a tour of the dashboard.
Navigating the Signals Dashboard

Think of this page as your daily command center. Every trading day, you can check out this page to see the Signals that are active on specific stocks. Let’s take a closer look.
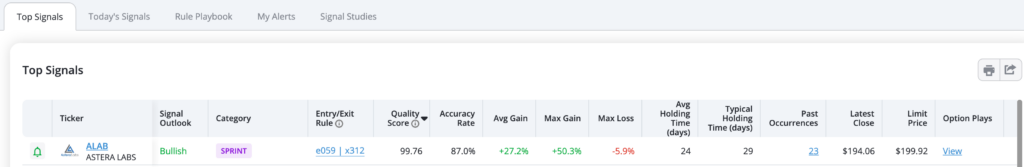
The first tab shows you the Top 20 Signals – the highest-quality setups available today, ranked by our system.
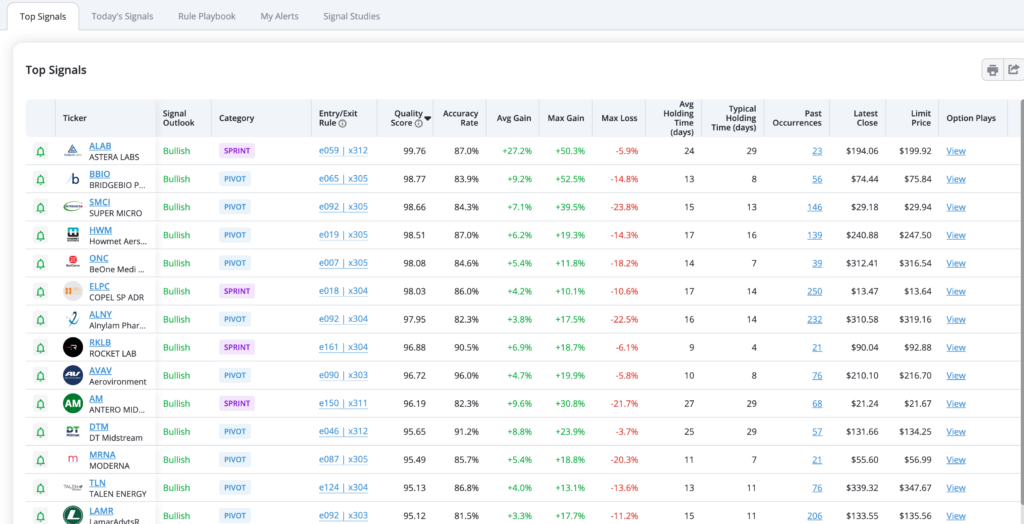
The column headings give you the vital information you need to properly evaluate each potential Signal trade:
- Ticker symbol
- Signal outlook (bullish or bearish)
- Signal category (hover over for definitions)
- Entry & Exit Rules (click link for details)
- Signal Quality Score (higher is better)
- Historical Accuracy Rate for that stock
- Average gain, max gain, and max loss for past Signals
- Average holding time and typical holding time
- Number of past occurrences (click on link to see the list).
And there are even more data columns not shown due to space limitations. This includes the stock price and suggested limit price, optional stop loss, and whether an options play is available.
The next tab on the page is Today’s Signals, showing all of today’s high-quality signals – currently up to 100, with more to be added over time.
With so many possible Signals to choose from, we’ve added the Filters button:
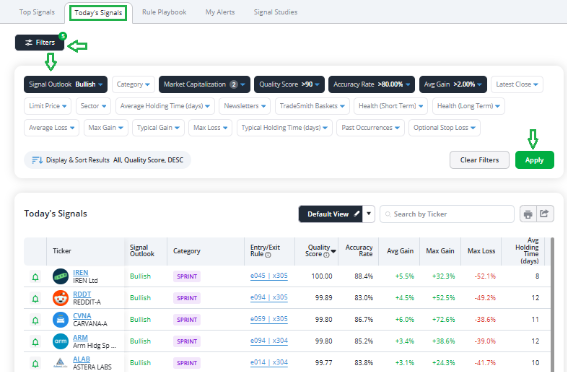
Similar to what you’ll find on our popular Screener page, here you can apply multiple filters to narrow your search for Signal trade opportunities.
The third tab on the page includes the Signals Playbook.
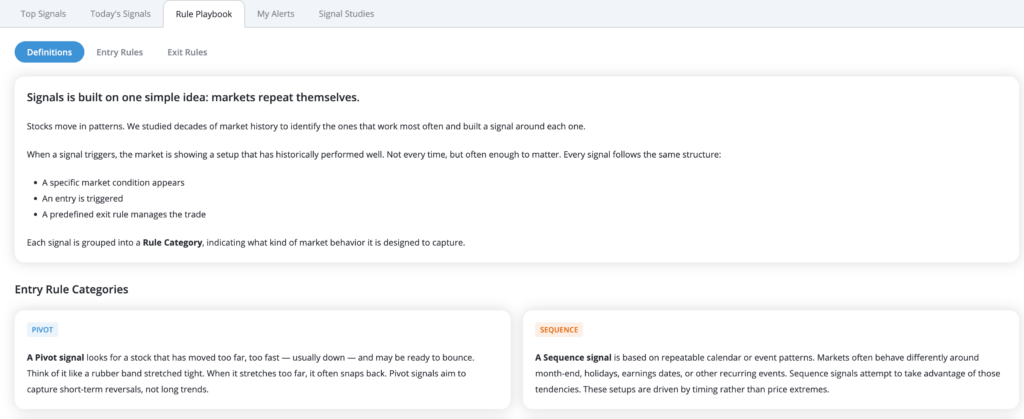
Here, you’ll find all the definitions we use in Signals, plus the detailed entry and exit rules for each potential trade.
You can refer back to this page as needed to better understand each Signal and its potential.
With the dashboard laid out, let’s see how to use it find a trade worth taking.
A Closer Look: Evaluating a Signals Trade
Most of the data columns in these tabs are fairly self-explanatory. But let’s dig deeper into one of these Signals, and I’ll show you step by step how I evaluate them as potential trades.
Simply click on any symbol in the Top Signals or Today’s Signals list.
Let’s take Astera Labs (ALAB) as an example.
For my money, the more data, the better. And scanning through the lists of Signals on the main page, you’ll find stocks with dozens and even hundreds of past Signals.
ALAB has only been public for a few years, but there have already been 23 Signal trades since 2024.
And they’ve been very profitable in the past, as you can see.
So, let’s take a closer look.
When you click on the ticker symbol, ALAB – or any other stock on the Signals lists – you’ll open the Signals page for that stock shown below.
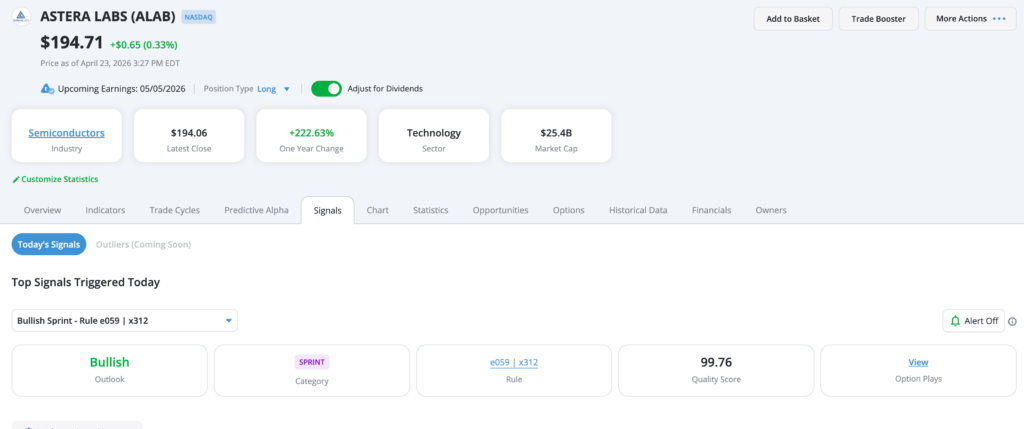
Here you’ll find a wealth of TradeSmith indicators such as Health, Business Quality Score, and much more.
Under the Signals tab, you’ll find data for this stock similar to what appears on the Signals list, but much greater detail.
Now scroll down the page a bit further and you’ll reach what I consider the most important data for evaluating any potential Signals trade: The Signals Performance section.
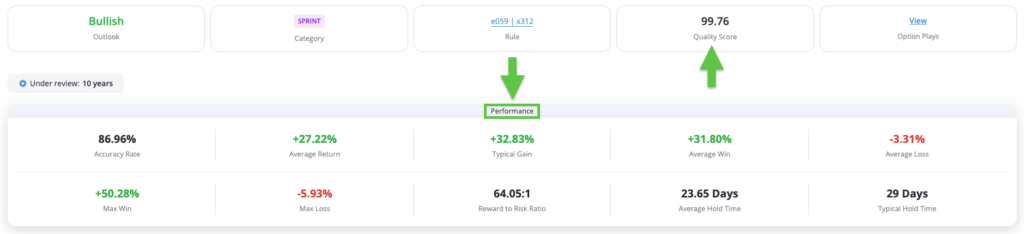
This section includes vital stats on the past results for all similar Signals trades on ALAB:
- Accuracy Rate: 86.96%
- Average Return: +27.22%
- Typical Return (median): +32.83%
- Average Win: +31.8% vs. Average Loss: -3.31%
- Max Win: +50.28%|Max Loss -5.93%
- Reward-to-Risk Ratio: 64.04-to-1
- Average Hold Time: 23.65 days|Typical Hold Time: 29 days
Here’s what stands out the most when I evaluate this Signal:
- Very high Quality Score of 99.76, it doesn’t get much better.
- A high 86.96% Accuracy Rate
- Average gain of +32.83% vs. Avg. loss of just -3.31%
- Even better, a very high Reward-to-Risk Ratio of 64-to-1
- Max win of +50.28% almost 10x the Max Loss of -5.93%
That makes this ALAB Signals trade well worth consideration in my book.
Just below these vital stats, you’ll find the Signals Event Path that shows the average historical trend of past Signals performance.
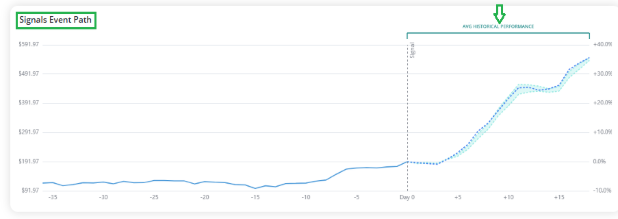
You can see the typical price path both before and after the Signal fires. For ALAB, it’s a steady, consistent rise beginning around day 5.
Further down below, you’ll find the Past Signal Occurrences table lists every historical Signals trade for ALAB, including the Return, Max Rise, and Max Drop for each.
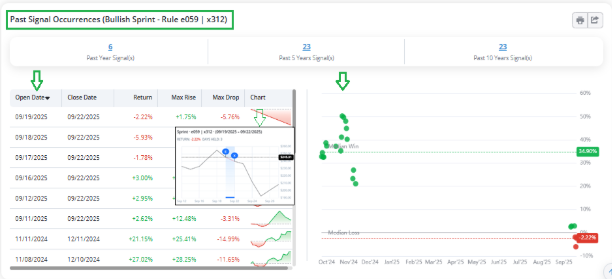
Simply hover over the Chart column for any trade to see a pop-up chart showing how that trade progressed from entry and exit.
To the left, you’ll find a Scatter Plot of past Signal trades for that stock. At a glance it shows you patterns of past performance:
- Again, you can see most of ALAB’s 23 signals were substantial winners, with a Median win rate of 34.9%.
- You can see a cluster of winning trades at left of the scatter plot.
- And there were just a few negative trades in the lower right, with a Median loss of only -2.22%.
That’s ideally what you want to look for prior to considering a Signals trade.
Above all, remember: you don’t have to try to take advantage of every potential Signal trade that comes along.
The best way to get started is to check out the Top Signals Trades every day and consider paper-trading those that look most appealing.
Keep a trade diary or Excel spreadsheet on the results to get a feel for how the different types of Signal trades play out until you have a better understanding of Signals.
And to help you understand Signals more fully before diving in, we have several informative guides available to bring you up to speed quickly about Signals:
- For definitions of the data in each column, be sure to review the Signals Dashboard Quick Start Guide.
- Before you get started with live trades based on Signals, another great resource to review is How to Use Signals.
- Some folks may consider trading options based on Signals. Before you do, be sure to review Selecting Options Using Signals.
Good investing,

Mike Burnick
Senior Analyst, TradeSmith