Inside the Market Pullback: Where Big Money Is Moving Next
The market may feel a bit shaky right now, but the story beneath the surface is far more interesting than a simple pullback. With selling pressure picking up and headlines turning gloomy, this is exactly when it pays to look past the noise – and where the “big money” is really moving.
That’s why I turned to my colleague, Jason Bodner for an insider read on what’s happening behind the scenes.
The S&P 500 Index is only about 4.5% off its recent record high, yet the pullback somehow feels worse than that. In fact, the blue-chip stock index recently broke below its 50-day moving average (DMA).
To some Wall Street analysts, that’s considered a bad omen for an even deeper downtrend in the stock market.
But let’s bust that myth right here and now, because the truth is not as bad as some would believe.
In fact, my colleague Lucas Downey crunched the data and put together this graphic that shows what typically happens to the S&P 500 after it breaks below this moving average:
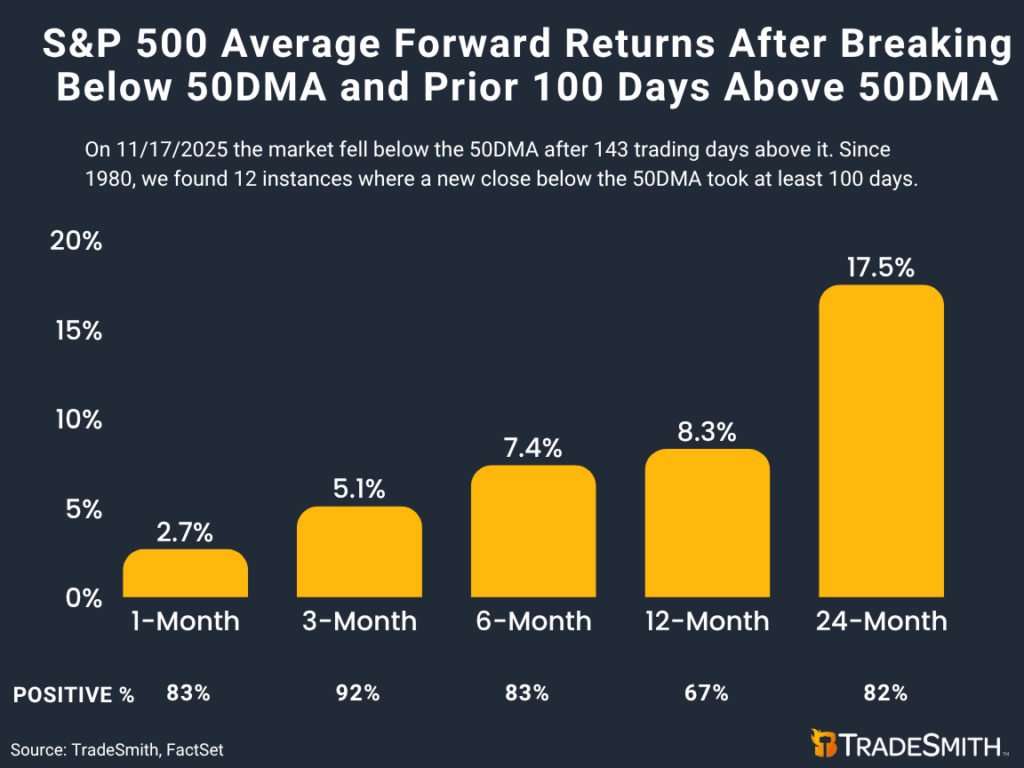
Average returns remain strong going forward, even after the 50-day is crossed to the downside.
There’s no red flag here warning of lower stock prices ahead.
So today, let’s dig deeper into the money-flow data Jason Bodner keeps tabs on, to get a clearer picture of what’s happening under the market’s surface – including potential buying opportunities.
Big Money Hits Pause
Jason’s proprietary Big Money Index (BMI) has slumped a bit since late July, even as stocks continued to rally.
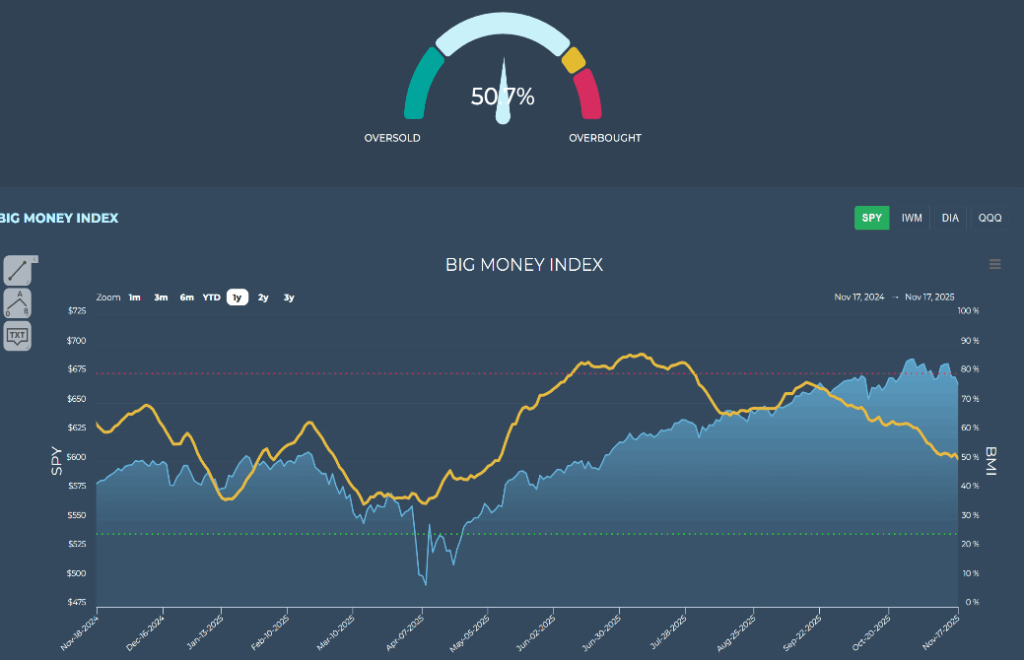
Today, the index is essentially neutral around 50%.
That means neither big money buyers nor sellers have the upper hand right now.
And while stocks may continue to struggle to regain upside momentum, Jason sees the recent choppiness as a normal pullback – “not the end of a bull and not the start of a bear market.”
After all, considering the big run since April, a pullback is understandable – even healthy. As Jason notes, “It reduces froth, and lays the foundation for the next leg up.”
He also is quick to point out: “These kinds of pullbacks create opportunities to buy excellent companies with superior fundamentals and a history of Big Money inflows.”
With that in mind, now is a great time to revisit Jason Bodner’s Quantum Scores on the TradeSmith Finance Dashboard page.
Quantum Scores Made Simple
Jason built a system that sifts through about 6,000 U.S. stocks, filtering for liquidity, quality, and strength through a robust set of technical and fundamental filters to isolate the top performers.
Altogether, this system creates a “Quantum Score.” And it shows you, at a glance, what the big institutions are buying before the stock makes a major price move. The Quantum Score combines these factors into one single number for each stock:
Fundamentals
- Sales & earnings growth
- Profitability
- Low debt
Technicals
- Volume
- Volatility
- New highs
- Institutional buying
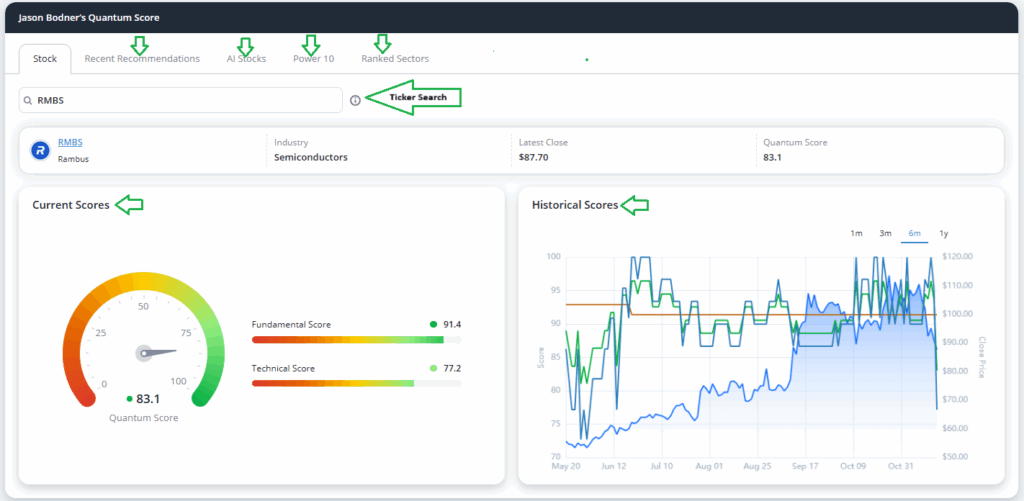
And by using this Quantum Score widget every single day, you’ll find stocks that earn high marks according to Jason’s Fundamental, Technical, and Quantum Score – in this case Rambus (RMBS) is shown below.
The scores are scaled from 0 to 100. And just like in grade school, the higher the better – with 100 being the best, top buy candidates!
You can also type your own ticker symbol to look up Jason’s Quantum Scores for any stock he tracks in his extensive database, to see how they measure up.
The chart on the right shows a historical graph of the Quantum Scores over time. This can help you track trends and patterns in both score movements and price action.
To find and use Jason’s Quantum Score, log into your TradeSmith Finance account. After you log in, you’ll find yourself on the Dashboard (or home page). From there, scroll down to find the Quantum Score section, as shown below:
If you don’t see this valuable tool in your TradeSmith Finance platform – and would like to – give our Customer Care team a call at 888-623-0858 to find out how to get access.
If you want more, there is even more detailed data available here to give you a constant flow of new investment ideas:
- Recent Recommendations: Jason’s Quantum Edge Pro, focused on small- and mid-cap stocks with standout scores and signs of Big Money inflows.
- AI Stocks: Top ranked artificial intelligence stocks with high Quantum scores.

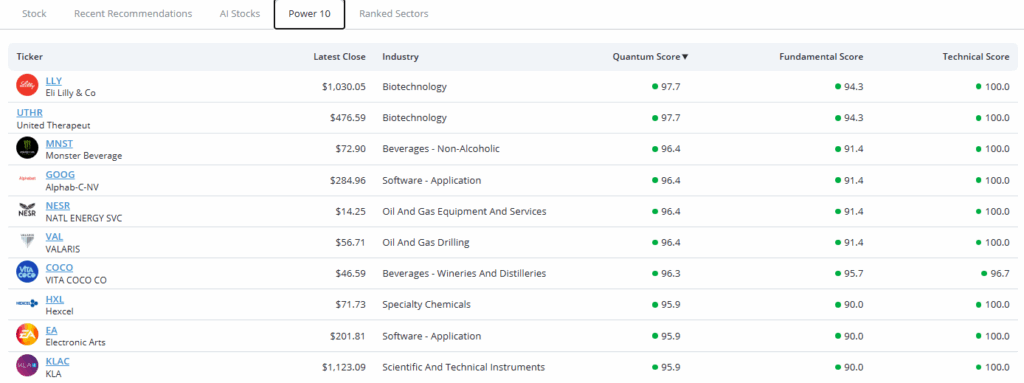
- Jason’s Power 10: Updated daily with his top 10 most liquid stocks that also have the highest Quantum Scores.
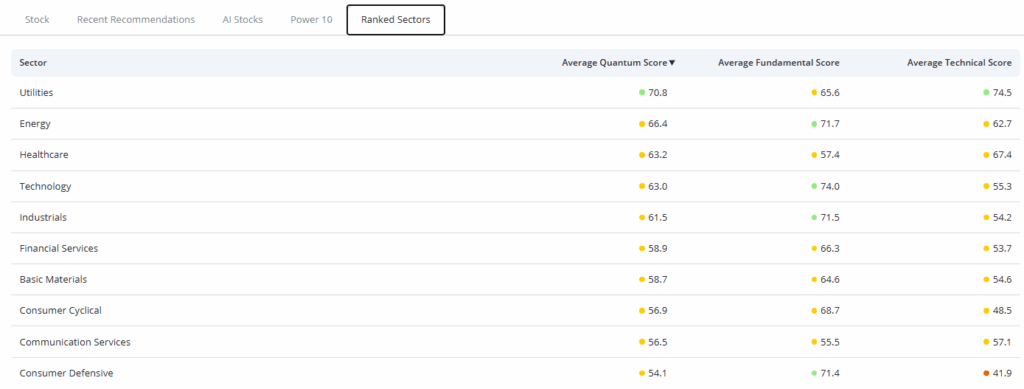
- Ranked Sectors: Each S&P sector ranked by the aggregate Quantum Scores of stocks in the sector, showing which sectors have big money inflows or outflows.
Finally, subscribers with access to TradeSmith’s Invest Screener can build their own screener based on Jason’s proven Quantum Score, plus your other favorite screener filters to find even more stocks that make the grade!
Mike Burnick’s Bottom Line: The stock market has just handed us the first decent buy-the-dip opportunity in more than six months. And if you’re looking for new stocks to add to your portfolio, look no further than Jason Bodner’s Quantum Scores to help you uncover top stocks with the strongest big money inflows.
Good investing,
Mike Burnick
Senior Analyst, TradeSmith
P.S. And that’s really the power behind Jason Bodner’s work. When you can track where the big money is moving before the rest of the market catches on, you gain a real edge.
That’s why what Jason has built goes far beyond a simple scoring tool. It’s the same kind of early signal institutional traders rely on every day… and it’s helped flag some of the most profitable opportunities long before they made headlines.
And if you want to see exactly what that system is zeroing in on right now – especially as the market continues to rotate money into long-unloved sectors – you’re in luck. The very same technology behind Jason’s Quantum Score is currently pointing to a new set of urgent opportunities.
You can see how it works – and even get the name and ticker of the latest stock big money is quietly piling into – right here.