Just the Facts, Please: TradeSmith’s Seasonality Tools Give You the Edge You Need in the Market
One of the most memorable phrases from vintage television history was Sergeant Joe Friday of Dragnet. He always insisted that “All we want are the facts, ma’am.”
At TradeSmith, our Trade Cycles tools are designed the same way: They show “just the facts” about seasonal market trends that tend to consistently repeat over time.
These seasonal trends can give you a big edge in your investment or trade timing, helping to place the odds of success squarely in your favor.
And if there’s one thing we love at TradeSmith, it’s presenting the facts and cutting out the noise.
In fact, our expert software development team recently made some big improvements to Trade Cycles by putting even more facts about seasonal trends at your fingertips.
The new Trade Cycles Statistics page includes a wealth of additional data on seasonal tendencies for individual stocks, indexes, ETFs, commodities, and many other assets…
Sharpening your trade or investment criteria even more – down to the best day of the week to place your trade.
Let’s take a closer look.
The Formula for Figuring Out the Best Seasonal Opportunities
To access the Trade Cycles Statistics page, simply log into your TradeSmith Finance account and enter any symbol in the Search for Ticker box. (Note: You must be subscribed to Trade Cycles or be a TradeSmith Platinum member to access the detailed seasonality stats.)

For this example, let’s take a closer look at seasonal stats for the S&P 500 (SPX) shown above. This takes you to the Overview page for that security. Next, simply click the Trade Cycles tab, then click on Statisticsto get all the seasonality facts.
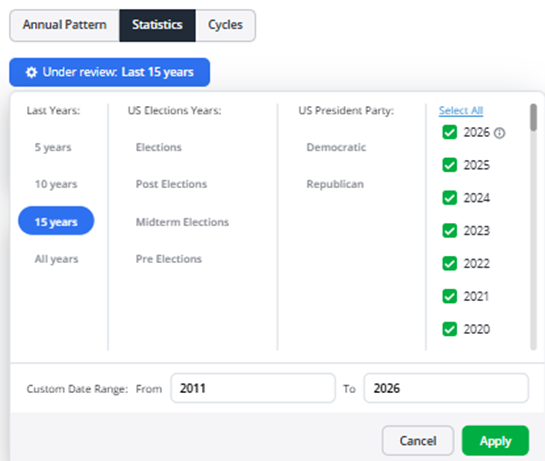
The default period under review is 15 years of seasonal data. But you can modify this several ways, as shown above. You can choose to review a specific year range or view them all in our database – and you can even choose any of the four-year election cycle periods!
Simply make your selections for the number of years’ worth of seasonal data you want to review and click Apply. For SPX, I kept the default at the last 15 years of seasonal performance data.
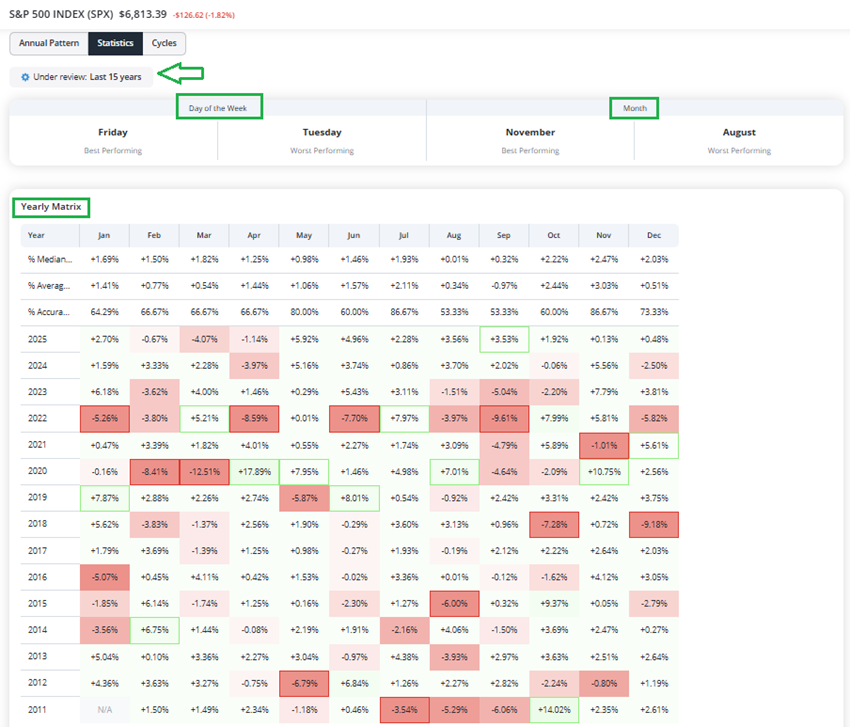
At the top of the page, you’ll find detailed performance stats on the best (and worst) historical Days of the Week and Months for SPX returns.
According to this chart, Friday has been the best performing day of the week, while Tuesday is the worst. Meanwhile, the best month for SPX is November and August is the worst.
Next, you’ll see a Yearly Matrix of SPX performance, where you can pinpoint winning and losing streaks over the past 15 years. Near the top of the page, the monthly and yearly stats are neatly summarized.
For instance, November is the best month to invest in SPX, with stocks up 86.7% of the time, while posting median returns of 2.47% (average returns = 3.0%) historically.
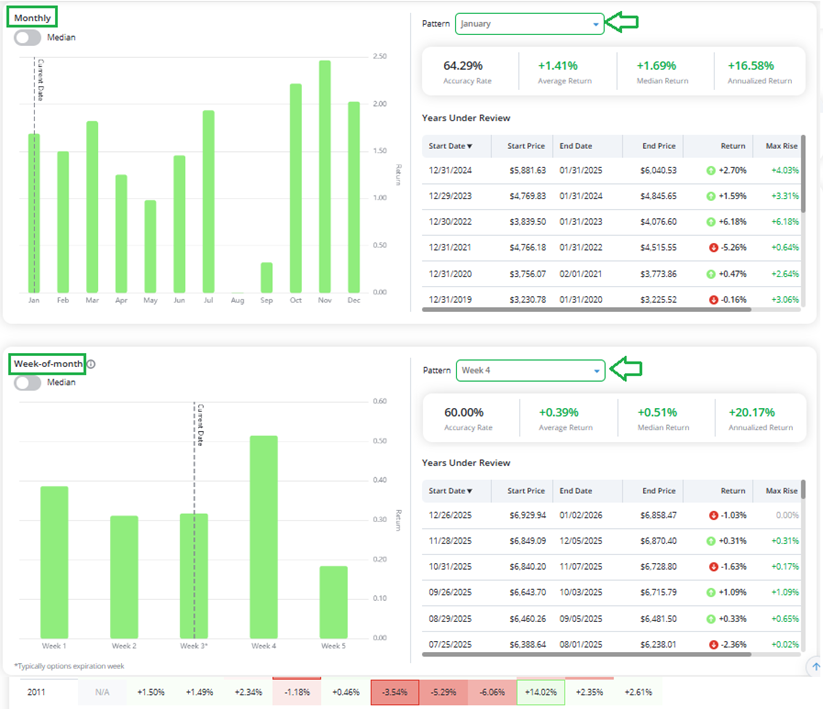
Scrolling down further you’ll see detailed performance stats for SPX month-by-month and week by week, as shown above.
This includes just the facts on performance historically, including the Accuracy Rate (% positive) Average, Median, and Annualized Returns for the SPX each month over the last 15 years.
Simply click in the Pattern box to select the month of the year – and/or the week of the month – that you want to view seasonal performance stats for.
For example, in the Week-of-month graph above left, you can see that week four in January has historically been the most rewarding time to own SPX, up 60% of the time with median returns of +0.4% (average = +0.5%). That’s an annualized return of +20.2%!

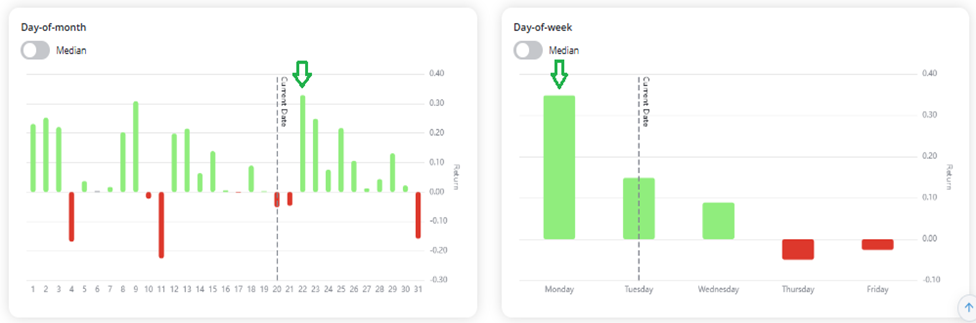
Finally, scroll to the bottom of the Statistics page to find even more fine-grained details, including the best (and worst) Day-of-month and even the Day-of-week performance stats, as shown above!
You can see that the SPX’s positive performance for the month of January builds – a good thing after such a bad start.
But watch out for the last day of January… Historically, it’s been up just over 50% of the time with negative median returns over the past 15 years.
And don’t forget, you can access the same detailed seasonal stats and historical data for many other assets, including individual stocks.
Here’s an example…
Even the Day of the Week Counts
Taking a closer look at tech blue-chip Apple (AAPL) for instance.
The best-performing day of the month is day #22… which just so happens to be today! Also, AAPL shares tend to perform best on Mondays.
Mike Burnick’s Bottom Line: Whether you’re a long-term investor or a quick-hit trader, success often comes down to getting your facts straight and your timing right. Trade Cycles Seasonality data can provide you with a major statistical advantage either way. Before you place your next trade, be sure to drill down and take a closer look at the seasonal stats to give yourself a valuable edge.
Good investing,
Mike Burnick
Senior Analyst, TradeSmith
P.S. Figuring out which stock to buy is critical… but knowing the exact timeline of your next trade – from entry to exit – pays off.
As you can see from the Trade Cycles Statistics, grabbing up shares of Apple on an uptrend any day of the week might not always pay off in the best way. Timing is everything. And earlier this week, we opened up the gates to let a few more folks into our Trade Cycles service… for a limited time.
If you act now, you can nab TradeSmith CEO Keith Kaplan’s #1 recommendation – for free! – plus, you can see which 15 stocks could’ve doubled your money in under 50 days in backtests. January’s the best time to get in on this… a whole new year of seasonal opportunities just kicked off.