Make TradeSmith Your One-Stop Shop to Monitor Markets and Your Investments
With headline turbulence moving the markets unexpectedly from one day to the next, keeping an analytical edge is now more important than ever when working to safeguard your wealth.
In times like these, you should visit our TradeSmith Analytics on the regular to help you make sense of all the volatile market action – even if you’re not a data-crazy “quantaholic” like me.
Whether you’re just looking to hunker down and manage your risk for the moment, or if you’re hoping to uncover new potentially-profitable trade ideas to play the short-term swings instead, you still need objective, top-level data to help guide you. Or as Dragnet’s Sgt. Joe Friday used to say… “Just the facts.” And our Platinum-grade analytics dashboard has you covered with all the data you’ll need.
In today’s Inside TradeSmith, I’ll show you how I use our analytics page daily to stay informed about what’s going on beneath the market’s surface and pick up valuable insights.
So, if you haven’t visited the Analytics page recently – or if this is your first time hearing about this TradeSmith feature at all – please allow me to show you around and help you get the most out of the wide range of market data we provide members every day.
Access Platinum-Level Analytics Straight from Your Dashboard
The TradeSmith Analytics dashboard is an exclusive feature of our TradeSmith Platinum membership: In addition to having access to our full range of offerings (including a few Platinum-exclusive strategies and publications, like Lucas Downey’s Alpha Signalsservice), Platinum members can review a staggering amount of high-level market data, right from the comfort of their TradeSmith Finance Dashboard.
And if you don’t yet have TradeSmith Platinum yourself — and would like to after hearing about this exclusive feature — keep reading: There’s an opportunity below you won’t want to miss.
To find TradeSmith Analytics, just log in to TradeSmith Finance. Then from the main Dashboard view, take a look at the shortcut panels just below the market status windows at the top of the page.
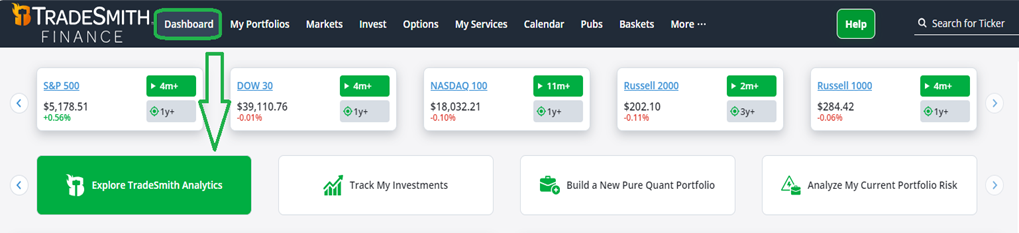
Mouse over the Explore TradeSmith Analytics window shown above and it will turn green. Go ahead and click, and you’ll see TradeSmith Analytics open in a new tab in your browser. Here’s a look at the main page view:

There is so much data here to review, it may seem overwhelming at first.
So, I’ll show you my own go-to sections of the TradeSmith Analytics page – and how I use them daily.
In the left-hand navigation menu, you’ll find your dashboard separated into six sections. Our first stop is the landing page we accessed straight from TradeSmith Finance, the main Analytics Data section.
Here you’ll find several data sets that can give you powerful insights into new investment ideas, and help you potentially avoid trouble brewing in your portfolio.
At the top of this page, you’ll see lists of the Most Overbought and Most Oversold Sectors,based on Relative Strength Index (RSI) readings. RSI is a key measure of any asset’s price momentum, and one of the first indicators I review when looking for a status check: the RSI score tells you if a given asset is currently overbought (with an RSI reading above 70) or oversold (RSI reading below 30) – which can help you expect upcoming price movements.
Every day, TradeSmith Analytics provides a list of the 10 most overbought and oversold sectors, pulled from a list of S&P 500 sectors, commodity-tracking ETFs, and industry-specific tickers. Click on any ticker symbol on the list, and it will take you to that specific asset’s Stock Analyzer page on TradeSmith Finance for further research.
Reviewing these lists recently, I’m seeing that gold miners and energy stocks are overbought, while those in the transportation and technology sectors are oversold.
If you’re holding stocks or ETFs from the most overbought sectors, you may want to consider locking in recent gains and reducing your position size. Or at the very least, you should be sure to review your protective stops on these overbought holdings.
On the other hand, when I’m looking for new ideas to put fresh money to work, I look at the most oversold sectors first – because the top entries on this list could be great candidates for buying on the dip.
Scroll down on the Analytics Data page and you’ll find a list of top stocks ranked by our Business Quality Score (BQS), one of my favorite TradeSmith indicators. BQS measures a stock’s profitability, growth, safety, and payout:

And next to this list of top BQS stocks is our data set of elite Trinity Stocks. These represent high-quality stocks that also have reasonable valuations and are in uptrends. Those are three qualities I look for in a great investment, making this list a great shortlist for researching new positions.
Scrolling a bit further on this same page takes you to a list of stocks ranked by Free Cash Flow Yield (FCF). I like to cross-reference this list and the BQS list with the oversold sectors and stocks shown above. Quality stocks with strong cash flow can provide plenty of refuge in down markets after all.
Finally, at the end of the Analytics Data page, you’ll see a list of stocks that make our Performance Leaders list, which can be explored via the dropdown menus below:
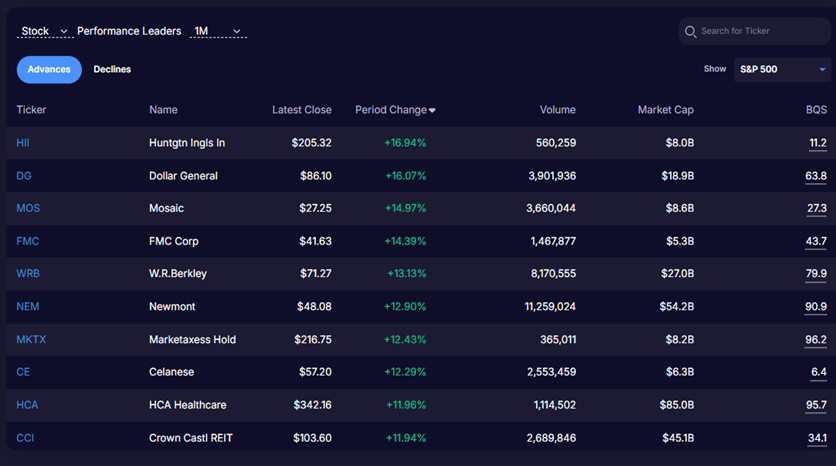
Click on the dropdown menus above the chart, and you can sort the list by either Stocks or ETFs, by one-month, six-month, 52-week, or year-to-date performance changes, and even switch between the list of Top Advances vs. Top Declines.
This is a great reference for which stocks and sectors are leading the market at the moment, and which are lagging behind the pack.
Right now, for example, I see several mining and materials stocks that are bucking the market’s downtrend.
I personally use this data to spot shifts in stock-market leadership: for instance, I’ve used this data to find out-of-favor stocks with poor 52-week momentum that have also moved up to the top of the one-month Performance Leaders list. These stocks could be starting a big comeback – so they go straight onto my watchlist.
And again, you can click on the ticker symbols in any of these views to easily do more homework on any of the stocks that make the list.
Our next tab on the left-hand navigation menu is for Market Data. Here you’ll find a handy heat-map of S&P 500 performance by stock and sector, to help you identify the biggest movers lifting the market or those moving lower in price:
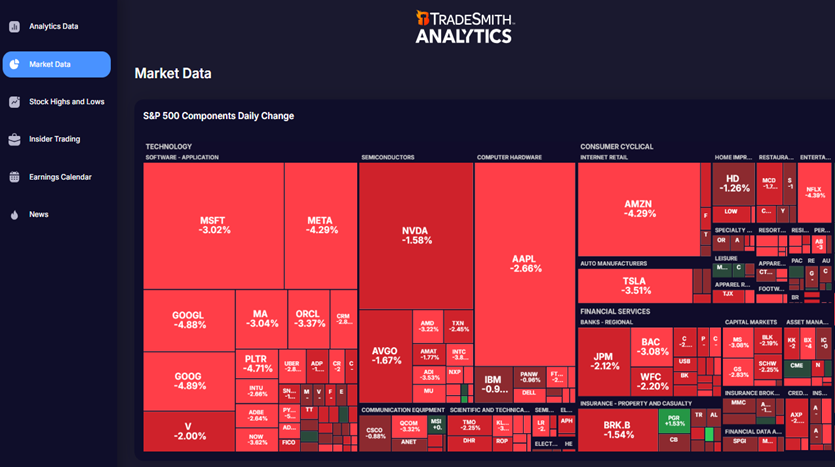
As you can see above, when I checked this page yesterday the markets were looking rough. Ouch!
Scrolling on, you’ll also find a color-coded list of U.S. and global market indexes – plus key commodity and currency market data you’ll want to review regularly. This is a great way for me to check at a glance which assets are hot – and which assets are not.
And a bit further down this page than that, you’ll see our good friend the Market Fear & Greed barometer. This gives you a quick but detailed reading on current investor sentiment, whether that sentiment is too bullish (greedy) or too bearish (fearful). Click the Read More button to return to TradeSmith Finance for all the details that go into this sentiment index.
Finally, at the bottom of this tab you’ll see S&P Sector Performance and Industry Performance data. As with the Performance Leaders chart, you can toggle between time frames (one-month, six-month, 52-week, or year-to-date) with the dropdown menus above each list.
These charts help me keep tabs on which sectors and industries are posting the best or worst performance, much like the Most Overbought and Most Oversold Sectors lists.
Moving on to the third tab on our Analytics Page takes you to the Stock Highs and Lows datasets. In this section, you’ll find an expanded list of stocks making new highs or new lows over various time frames:
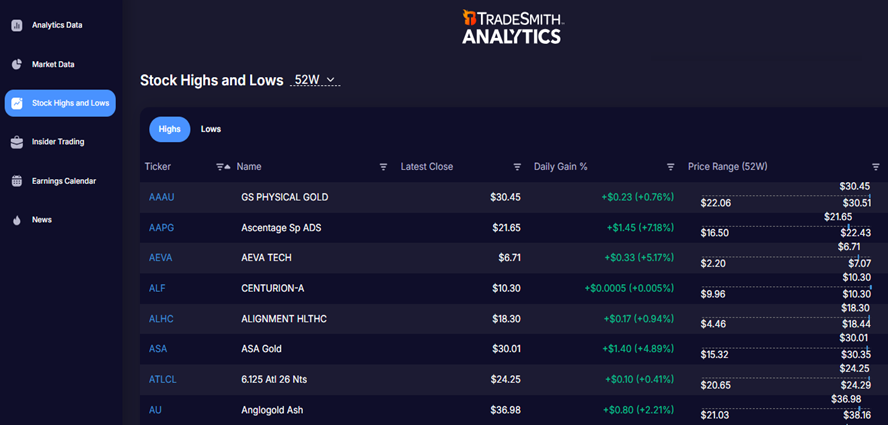
Once again, you can use the dropdowns and Highs/Lows toggles to navigate through this data.
You don’t want to find stocks you own on the 52W Lows list. But it’s also helpful to see what stocks are rising to the top, even in a volatile, down-trending market like we’ve seen recently… like the laundry list of gold-related stocks shown above.
The next tab on the Analytics page menu is Insider Trading: Here you’ll find a comprehensive list of stocks and trades by Wall Street insiders, as shown below.
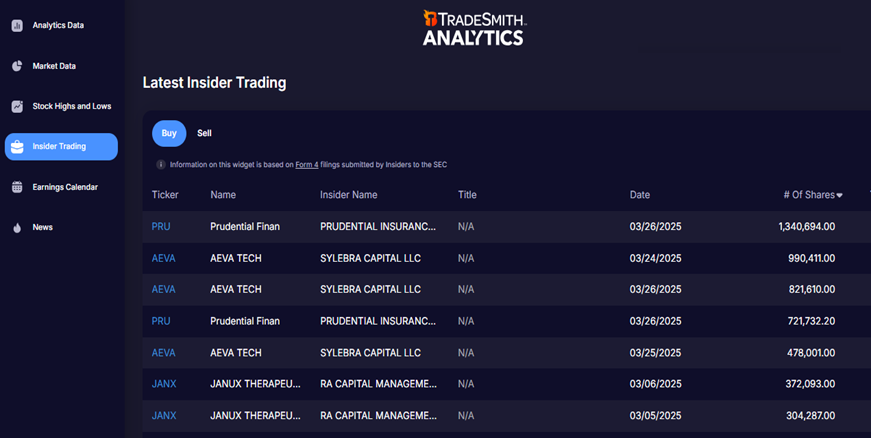
This data is based on recent Form 4 filings that insiders are required to submit to the SEC. The data in this chart includes the name and title of the traded asset, the insider placing the trade, along with transaction dates, the number of shares bought or sold, and the price the trade was made at.
Recently, insiders had an appetite for Prudential Financial (PRU) and AEVA Technologies (AEVA), with both attracting new buys in recent days.
The next tab down is our handy Earnings Calendar. During earnings reporting season – which is coming up again in a few weeks – I’m on this page every day to see which stocks are reporting and when:
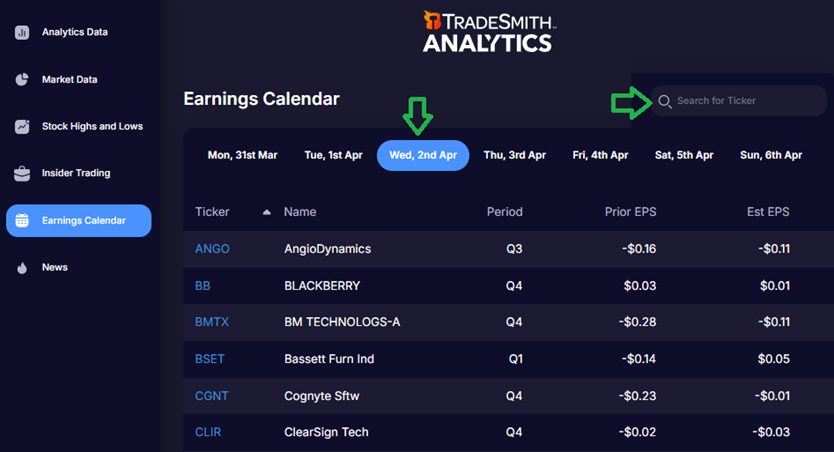
In addition to the day-to-day calendar navigation, you can use the Search for Ticker feature to find financial reporting dates for specific stocks you may own or are considering picking up. This is especially useful for those of you who are considering earnings season options trades.
This data includes the Prior-period EPS reported during the company’s last earnings release, compared to current analyst estimates (Est EPS) and the actual results if already available… plus estimated and actual revenue results.
Finally, don’t forget the latest News found in the last tab in our navigation menu: On the final tab of our Analytics page, you’ll find the latest news you can use from a variety of sources, including reports from the Associated Press (AP), Business Insider, CNBC, The Wall Street Journal, and many more:
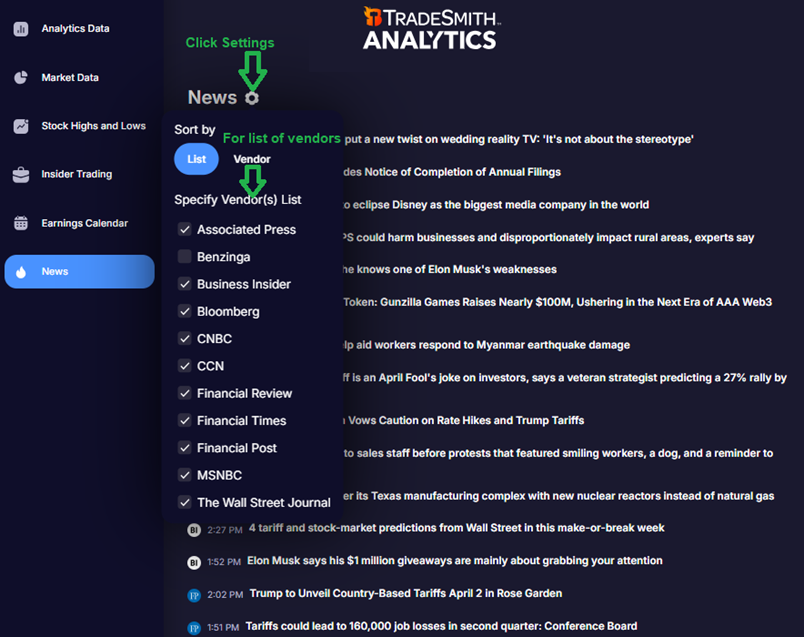
This includes general market news as well as headlines on individual stocks you may hold. Plus, you can filter by source in the settings menu, as shown above, and select only those news sources that you know and trust.
Mike Burnick’s Bottom Line: Our TradeSmith Analytics page should be your first stopeach trading day to get in-depth insights on the markets. As a TradeSmith Platinum member, with full access to all our data, portfolio strategies and tools, you can use our powerful Analytics dashboard to generate new investment ideas, keep tabs on the shifting market trends, follow the market-moving news, and keep track of insider buying and upcoming earnings… all in one convenient place.
Good investing,
Mike Burnick
Senior Analyst, TradeSmith
P.S. The top-level market data available via the Analytics dashboard is exclusive to our TradeSmith Platinum membership – but it’s not the only reason to consider upgrading. As TradeSmith celebrates its 20th anniversary this year, we’ve recently made that all-access membership more valuable than it’s ever been before.
Last week, TradeSmith CEO Keith Kaplan went live to deliver The Big Reveal – a blockbuster event where he shared major upgrades that are already rolling out to TradeSmith as I write this issue.
In his presentation, Keith covered the latest tools, product launches, and system upgrades coming down the pipeline – all designed to give you even more control over your investments. And to sweeten things even further, Keith announced the addition of a few new world-class analysts who are joining our dream team of market experts.
During the event, Keith also unveiled an extraordinary anniversary offer, giving attendees access to premium products like Seasonal Edge and Predictive Alpha – in addition to the powerful suite of TradeSmith Analytics data we covered today. But if you’re interested, you’ll need to act fast: today is your last chance to take advantage of Keith’s offer.
Don’t miss your chance to see what’s new and get in on the anniversary celebrations – watch The Big Reveal replay now.