
March 27, 2025: Interview with Lucas Downey (Full Transcript)
Click HERE to return to the full Inside TradeSmith issue.
Click HERE to Watch (12:13 min. watch)
Full Interview Transcript
Mike Burnick (Senior Analyst, Inside TradeSmith): Hello, everyone! I’m Mike Bernick, Senior Analyst here with TradeSmith – and joining me today is Lucas Downey.
Hey Luke, good to see you again.
Lucas Downey (Editor, Alpha Signals): Hey Mike, how are you? Good to be here.
Mike: Yeah, last time I was up in Baltimore a couple months ago. It was kind of cold back then, so it’s good to see you again.
Lucas: Hey, seasons change – and the same thing happens in markets apparently.
Mike: Yeah, for sure. We’ve learned that lesson the hard way in the last month or so, haven’t we?
So, a little background before we get started: Lucas is a TradeSmith Analyst who frequently contributes to TradeSmith Daily, so you’ve probably seen his columns.
Always great stuff, by the way, Luke. I read it all the time.
And Luke recently launched the Alpha Signals alert service, which is an exclusive for TradeSmith Platinum members only.
And Luke, I do want to cover the Alpha Signals because it’s really exciting stuff. But first, I want to talk about the genesis for that – which was your own unique signal study that you started last year.
Tell us about these signal studies?
Lucas: Absolutely. So really, years ago, I started really being all about evidence-based investing.
Mike: Well, that’s what TradeSmith’s all about, right?
Lucas: It totally is. There are all these news headlines that change day by day… I’m sure people out there, they see it, tariffs are on, they’re off. You really can’t make heads or tails of it.
Stocks are moving around, and it’s just really hard to cut through the noise by listening to all of these little ancillary items.
So, what I really gravitated to – and also what I think fits in well with TradeSmith – is evidence-based research. And so, what we started to do when we started doing these… I guess backtest trades? These are paper trades.
We started looking at specific stocks, or it could be ETFs. And maybe they do something unique – so maybe their dividend yield reaches a level that it hasn’t been at recently. Maybe the stock has pulled back a large percent.
We can go back and test, how many times has that happened in the past? Is it rare? And more importantly, what tends to happen going forward?
So, we’re doing those types of signal studies to really stack the odds in our favor – so that we can go initiate trade ideas where we know that the odds are in our favor, right?
Mike: Right. Well that’s what TradeSmith is all about, as I said, and what you’re doing with the signal studies then is really very similar to our Trade Cycles and Seasonality tools.
But the difference here is that you’re specifically focused on finding these unique moves or extreme moves in markets or in stocks or ETFs, and then seeing what happens next. And that’s the key, that’s the $64,000 question, isn’t it?
Lucas: That it is. And I think it’s very important to realize that, you know, looking backwards can only tell you so much.
So, as an investor, as a trader, you’re really trying to take as much information as you possibly can, build a picture and decide “Hey, do I want to put this trade on?” right? Because there’s tons of signals.
And so, a great example that really sets Alpha Signals apart is, we’ve got all these potential buy signals, right, that are flashing all the time, but we just had the market reach a correction. Which historically says that stocks are due for a bounce.
So Alpha Signals might take advantage of that by saying, hey, we might want to be a little bit more aggressive on the buy side, because history says the market moves could be more explosive to the upside. And therefore, we may want to get a little bit more aggressive on the single stock trading aspect.
Mike: Exactly, and that makes perfect sense. So, as an example, this intrigued me recently: You published a signal study in TradeSmith Daily. And you asked folks the following: “Are you brave enough to buy small caps?”
Tell us more about that signal, and what the potential of it might be.
Lucas: Well, let’s go ahead and pull this up – because I think this is very powerful.
What I strive to do in TradeSmith Daily is to look at data in different ways and try to come to a narrative. Come to some type of thought process that people may not be able to see with their own eyes, right? So, what we noticed was that small caps… well, if you’ve been holding small caps, you’ve been feeling the pain lately.
Did you realize that they’re down 19%, almost in a bear market? So this has been very, very painful. Now on the surface, you may say, “Wow, we’re reaching prior levels, right?” And maybe we are, maybe that makes it a good signal. But what I found made this a great signal is, well, I went and I looked at the number of stocks in the S&P 600. This is the small-cap index.
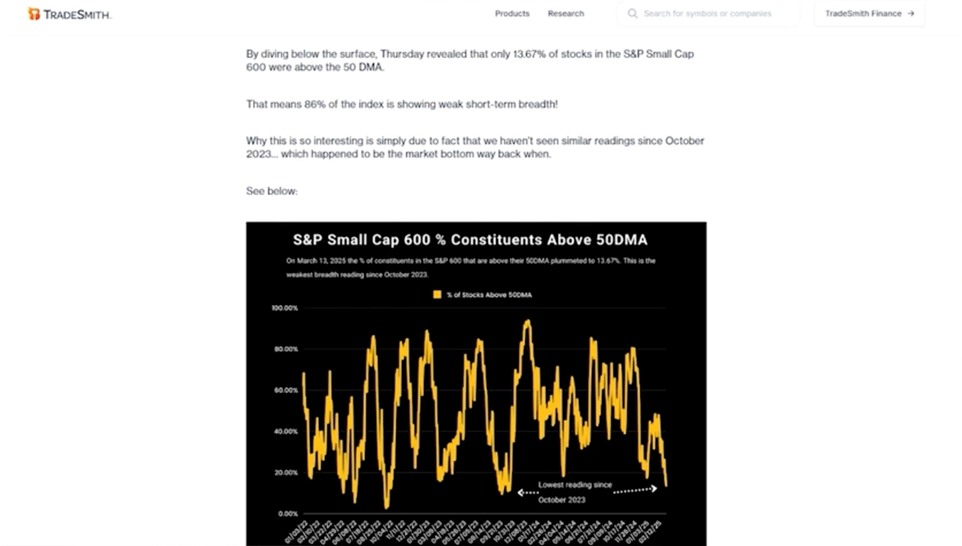
And here’s what was interesting: On March 13, it was an ugly market day. Only 13.67% of the stocks in the basket were above their 50-day moving average. And what made it so unique is that barometer alone, that’s the lowest level by this breadth indicator since October 2023.
So, it was just literally off the charts, and I wanted to go and test this to see if there’s some efficacy to what could come next.
So, to take it a step further, right, because you want to give even more value, I did the same process, but this time I looked at the 200-day moving average.
Mike: OK, the longer-term moving average.
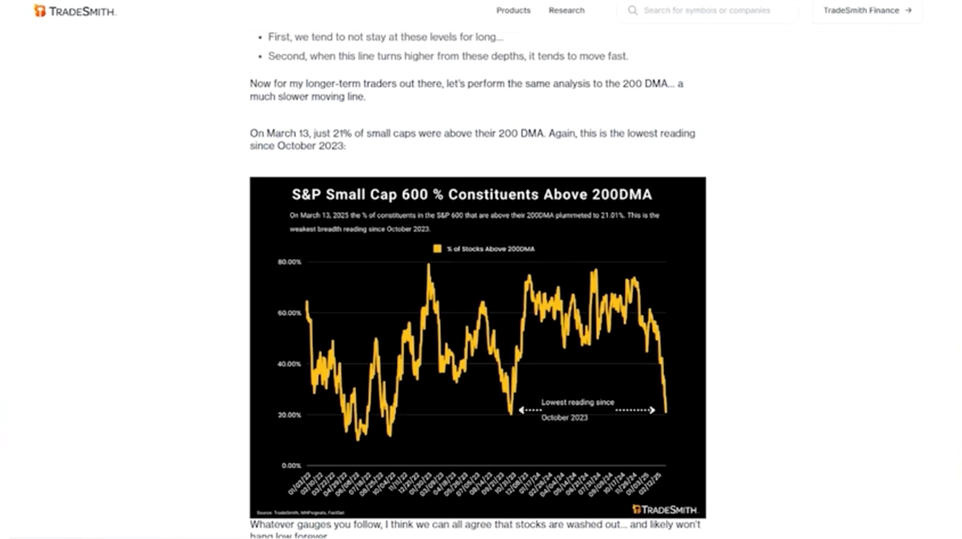
Lucas: That’s right. So, if you’re a short-term trader, you’re looking at the 50-day moving average, and if you’re a longer-term trader or investor, you’re looking at the 200-day. Well, we see a very similar setup – and what I noticed just with my eyes was that wow, we tend to not be at these levels for long. You tend to see the moving averages start to move up afterwards.
And then we went and we looked at what was the forward returns – and here’s what got me super excited and saying, “Are you brave enough to buy this dip?”

And basically, we got two studies. I’ll do this very quickly.
If we look at historical times when the number of stocks above this moving average is 13.75% or less… Look at this: You’ve got these very big market-beating gains with a very high hit ratio, and that’s for the 50-day. And then we did the same thing with the 200-day and you kind of get the same flavor. And so, you start asking yourself “Am I supposed to be a big bad bear, or am I supposed to be buying into this dip based on history?”
Mike: Yeah, well, we’ve definitely seen a lot of pretty bearish market days recently!
But you’re right: When markets get oversold to the extreme, and you back that up with the hard data that tells you, “Well, you know, everybody’s selling in a panic, but here’s what happens next,” and as you said, it’s up 100% of the time for small caps with average gains of… what was it, close to 30%, right?
So, you need to at least be aware of that. Taking, you know, kind of the other side of the argument, so to speak.
Lucas: Yes, totally. So, I mean this is going to fly in the face of a lot of trend indicators, right? So, if you’re looking for positive momentum, you’re not really going to see that with the service sometimes.
Now, obviously when we’re trending higher than the data everything’s going to be facing that way. But when we have these big steep pullbacks, what we’re trying to do is give hedge fund quality research.
Because this is what a lot of those guys and girls are doing, right? They’re looking at all these different relationships, trying to see how far the rubber band is stretched. And you know, if we get any hint of positive news, stocks could come flying from these oversold levels.
Mike: Yeah, that’s for sure. And you know, you mentioned an important thing, you know, hedge fund quality research. I mean, the TradeSmith platform is like having a team of hedge fund analysts right on your desktop really. And your signal studies prove it.
So, tell us more about your recently launched Alpha Signals trading service. That’s where you take some of these extreme signals and you actually make individual trades.
Now this is available to TradeSmith Platinum members only, is that right?
Lucas: That’s right. So, it’s just a Platinum offering at this point right now, and yeah, so basically what we’ll do is we’ll look at different types of signal studies. I’ll show you our latest one, that way you can kind of get a flavor for what we are about.
Mike: Good, I can log into my Fidelity account and place the trade right as we speak.
Lucas: There you go! So again, remember – where are we in the stream of things, right? I just said the markets are washed out. They look oversold. History says we’re due for a big bounce.
So, what I’m looking for in Alpha Signals in that type of environment are names with explosive potential. And so, look at this:
There are a lot of names out there that have been free falling, because there’s been selling by hedge funds. I’ve been seeing it in the data. You’re also hearing about that from a lot of the news outlets.
And I think one of those names that was high-quality was getting caught up in that sell-off is Restoration Hardware (RH).
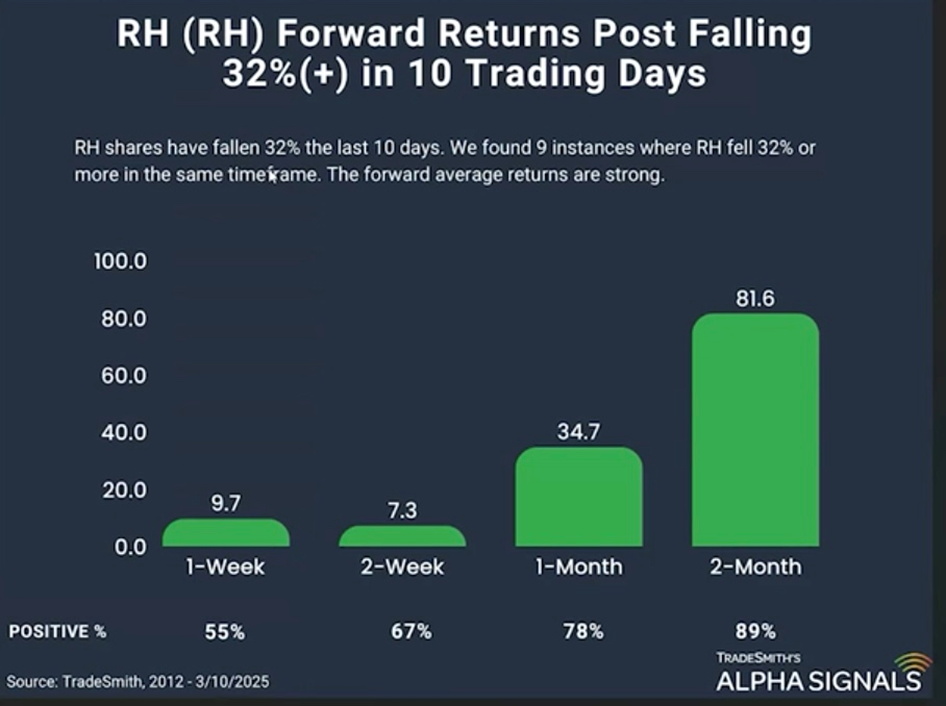
And what was really interesting, and we have a lot of awesome modules that are internal at TradeSmith, is we can go in and say, OK, RH fell 32% in 10 trading days.
So, in two weeks, the stock lost a third. OK, scary chart.
So, we were able to go back and look at periods where RH fell 32% or more in a 10-day period. We found nine instances.
And I mean, look at this: You know, one week later, two weeks later, one month later, two months later… these are big potential gains.
And what I try to tell everybody is, hey – don’t expect us to make 81%.
But to be stacking the odds in our favor… if we do get a big short squeeze in the market, these are the types of names that are going to have to rate higher, or at least I believe they’re going to be rating higher.
And these are the type of signals that we’d be taking in Alpha Signals. And then, if we get gains that are above these expectations, we might take this name off. And you know what, we have the latitude where if the trend continues to work in our favor, we might hold this trade out to 2 months or 3 months, you know, to really try to get the most out of that trade.
Mike: Sure. Well, like you said, there are a lot of high-quality stocks that are extremely oversold these days after the recent correction.
You know, the market’s been down something like six out of the last nine weeks straight. Which is unusual – a selling stampede. When you see something like that, usually you get a bounce back. And you know, maybe we’re seeing that, and maybe RH will go on to jump and bounce back 80%.
Lucas: Fingers crossed! It’s totally possible. I think I saw that the S&P corrected in, I think it was 16 days? And I think that was the second-fastest correction from all-time highs in history.
I think the other one was 2020 during COVID if I got that right.
Mike: The only faster correction. You are correct, yes.
Lucas: So, I mean… Listen, I was there during COVID. I was buying stocks during that.
It was painful, but those were some of the best trophy case purchases I ever made in my career.
Mike: Yeah, there you go!
Well, I can go all the way back to the 1987 crash – and everyone was convinced the bear market was coming and it was going to last for years and a recession was coming… and of course stocks bounced right back. Within a year we’re at new highs.
Well, Luke, thanks for joining me today. Fascinating stuff, the Alpha Signals. I can’t wait to see more of your stuff!
Lucas: Thanks for having me, Mike. I love having these conversations.
I love what you do, I love reading your commentary, and thanks so much for having me today!
Mike: Absolutely. We’ll catch up again soon.
And I’ll see the rest of you next time. I’m Mike Burnick, for TradeSmith.
Have a great day, everybody – and thanks for watching.