Mark Your Calendar: This TradeSmith Tool Found 61 Seasonal Trades in the Next 30 Days!
Well, we’ve made it through the first full week of the new year.
As far as the market’s concerned, it’s so far, so good – as stocks just passed their first hurdle of 2026.
You see, the S&P 500 Index closed higher last week, gaining 1.1% over the first five trading days of 2026. While that gain might not sound like much on its own, according to the January barometer that bodes quite well for the full month of January… and by extension, the full year as well.
Let me explain in more detail.
The “First Five Days” indicator and the January Barometer are two similar market signals that say “as goes January, so goes the year” – at least as far as stock market performance is concerned.
The theory is that if the first trading week of the year begins on a high note, and if the full month of January goes well for the market, then that performance should act as a forecast the market’s direction for the rest of the year.
Plus, early gains often lead to bigger and more consistent annual gains for stocks.
While the idea might seem strange, the hard data helps back this up. Take a look for yourself in the chart below:
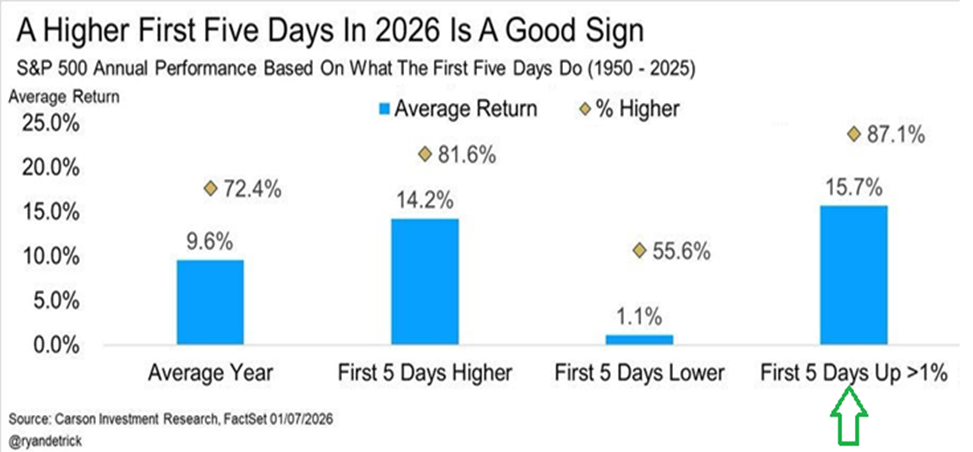
As you can see, based on trading data going all the way back to 1950, after a positive first five trading sessions of the year, the S&P 500 has closed the full year higher 81.6% of the time. And even better, the index posts an average annual gain of 14.2%.
That’s a great batting average, well above a random sampling of average market returns – which sees the S&P 500 up 72.4% of the time, with an average annual gain of 9.6%.
In addition, when the first five trading days of the year are positive for stocks, it indicates that gains will likely continue for the full month of January… which in turn tends to signal full-year gains for the market.
Sure enough, when the S&P 500 is up during the month of January, the index has gone on to close the year higher nearly 80% of the time, delivering a median yearly gain of 11.8%. That’s based on data going back to 1928 – an impressive length of time!
And the more stocks advance in early January, the better the full-year gains can be.
As shown in the chart above, the historical data shows that when the first five days of January leave the S&P 500 up 1% or more, the index closes the year higher 87.1% of the time for the full year, with even stronger annual gains averaging 15.7%!
To take advantage of this new year’s bull signal, you’ll want to lean into the market’s existing bullish trends… and TradeSmith’s powerful seasonality tools make it easy to find those trends with a few clicks.
In today’s issue of Inside TradeSmith, we’ll go searching for January profit opportunities by paying close attention to our Trade Cycles Seasonality Calendar. That’s where you’ll find the best seasonal profit opportunities for individual stocks.
And it’s the perfect time to search. By my count, there are no fewer than 61 optimal seasonal bullish signals waiting for you to take advantage of – in the next 30 days alone!
Clear Your Calendar for a Windfall of Seasonal Profit Opportunities
The thing about stock market seasonality is that the strongest opportunities tend to come in bunches at certain times of the year. The beginning of the new year is one of those times.
Our Trade Cycles Seasonality tools give you the ability to pinpoint potential bullish seasonal patterns for individual stocks, ETFs, and many other assets tracked in the TradeSmith database. These are historically reliable periods when certain assets typically trend higher, and they repeat year after year.
With the Seasonality Calendar, you can get a day by day (or week to week) view of these seasonal trading opportunities as they arrive – and easily plan your trades in advance over the next three months, six months, or even the next year!
And a quick glance at the Trade Cycles Seasonality Calendar will show you that there’s a target-rich seasonal trading environment just ahead!
Let’s take a closer look.
A 30-Day Forecast from Our Seasonality Calendar
To access the Trade Cycles Seasonality Calendar, simply log in to your TradeSmith Finance Dashboard, then open the Calendar page from the main menu bar up top. Next, select the Trade Cycles Calendar tab on sub menu, as shown below:
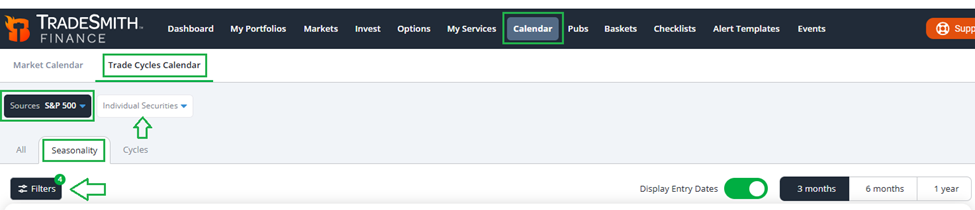
Members with subscriptions to Trade Cycles and TradeSmith Platinum can access the full range of TradeSmith’s Seasonality and Timing tools, including the handy calendar of upcoming bullish seasonal patterns on this page.
If you don’t see this valuable calendar tool in your TradeSmith Finance platform – and you’d like to – stay tuned for more details.
Once you’ve opened the Trade Cycles Calendar, you’ll notice you have plenty of options to customize the seasonality data you want to view.
First, click to open the drop-down menu at the top left of the page, labeled Sources. From this menu, you can select any of your own saved portfolios or watchlists to review the upcoming bullish seasonal windows for those stocks.
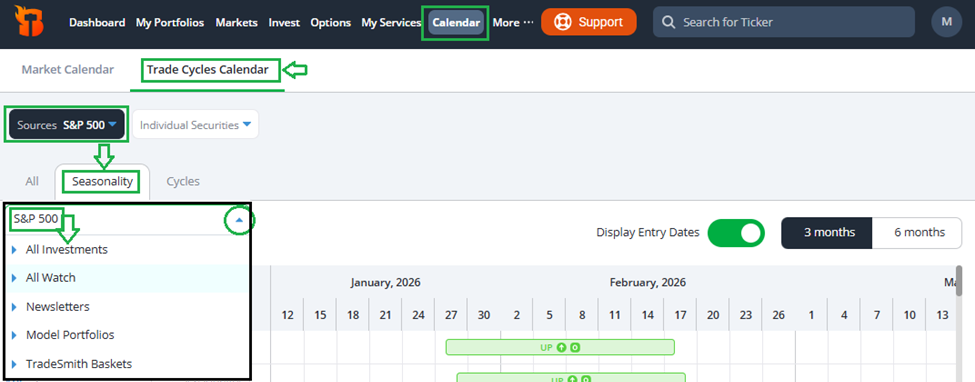
You can also view seasonal windows for Newsletter portfolios you subscribe to, TradeSmith Model Portfolios, or TradeSmith Baskets – you can review anything from the full list of S&P 500 Index components to the most specific group of stocks you can think of.
And you can always look up a specific stock in a flash, by simply clicking on the Individual Securities tab, to the right of Sources, and typing in the ticker symbol of your choice.
Finally, you can use the toggles to the far right to select the time frame you want to view in the calendar, to review seasonal windows across either the next three or six months.
Further down the page, under the Filters tab, we’ve included several preset filters to help you narrow your search for bullish seasonal patterns:

As shown above, these filters include…
- Asset Type (stock, crypto, commodity, etc.)
- Health (Green, Yellow, or Red Zone)
- And several specific Seasonality Pattern filters that can help you zero in on the best upcoming opportunities, all according to the timing, accuracy and annualized returns of the seasonal patterns.
To illustrate how to use the calendar, I chose the S&P 500 Index as my source here, which you’ll find under the TradeSmith Baskets tab.
Today, I want to filter for Seasonal Patterns with the highest odds of success. So, I chose to include the Optimal Seasonal Patterns Only filter – and toggled it to Yes.
Here at TradeSmith, we performed extensive research to find stocks with the most ideal seasonal patterns and the highest accuracy rates. To qualify as an Optimal Seasonal Pattern, the stock must have…
- A historical accuracy rate of 80% or higher…
- An average historical return of 4% or more…
- Annualized return of 20% or greater…
- And at least 15 years of historical data.
With all the Filters set, I simply click on the green Apply Filters button to see my results in the Calendar view – which you can see for yourself below:
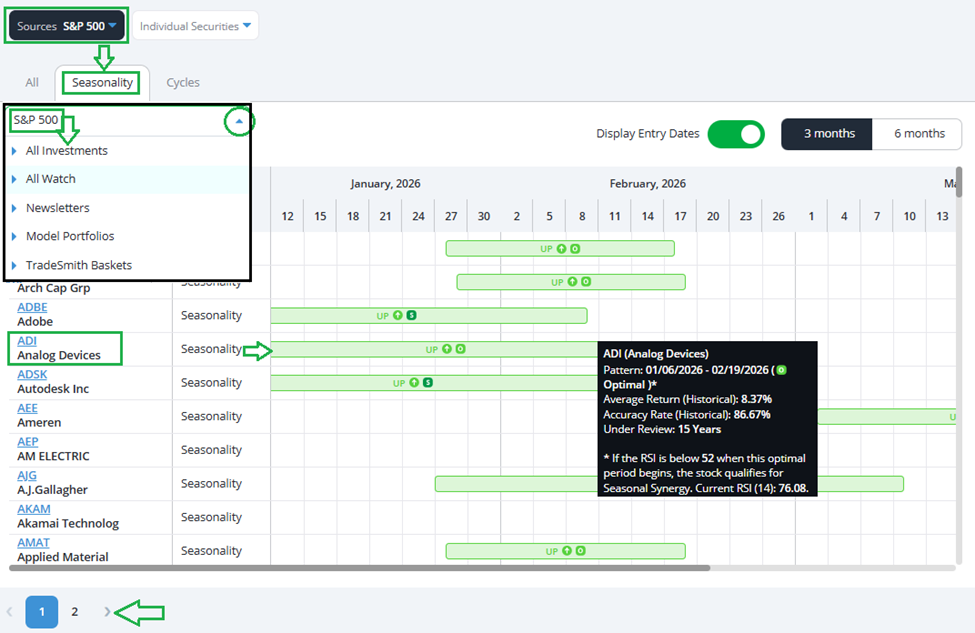
As you can see, there are plenty of opportunities to choose from over the next three months, with two full pages of S&P 500 component stocks that have bullish seasonal patterns coming up soon. The screenshot above just shows a few results, but scrolling down the page will reveal plenty more!
The green shaded calendar periods labeled UP display the bullish trading windows identified by our Seasonality tool. Simply hover over the shaded period for any stock, and a pop-up window gives you all the key details about the upcoming seasonal pattern, including the exact start and end dates.
For example, semiconductor giant Analog Devices (ADI) is in the middle of an Optimal Bullish seasonal window, which opened last week on Jan. 6 and closes on Feb. 19.
Historically, ADI shares have gone up during this period 86.7% of the time over the last 15 years – posting average returns of 8.4%.
By clicking on the ticker symbol at the left of the results list, you can jump straight to the Asset Details page for ADI. From there, you can do more research by reviewing the stock’s Health and Risk ratings, browse recent financial results, or even take a deeper dive into the Seasonality data – or any other TradeSmith indicators you fancy.
With the Trade Cycles Seasonality Calendar, you can create your own watch list of bullish seasonal patterns starting soon, and even set alerts to notify you on the exact day when these stocks start to make their move. With just a few clicks, you can mark your calendar for seasonal opportunities all through the year!
Mike Burnick’s Bottom Line: January is off to a good start, as the first five trading days of the new year saw the S&P 500 posting solid gains already. That’s a bullish sign for the stock market… and it could lead to higher full-year market returns.
When stocks rise in January, I like to follow the bullish trend. And for my money, our Trade Cycles Seasonality Calendar is the easiest and best way I know of to follow that trend – by searching for seasonal opportunities in individual stocks across all your favorite TradeSmith baskets and portfolios.
Right now, it’s a target-rich environment for bullish trades. By my count, you’ll find 61 optimal seasonal patterns in S&P 500 stocks coming your way in the next 30 days alone! And with the Trade Cycles Calendar, you can chart out even more seasonal trades before they begin, all year long.
Good investing,
Mike Burnick
Senior Analyst, TradeSmith
P.S. The Trade Cycles Seasonality Calendar is a great way to review upcoming seasonal periods at a glance, whether you’re searching through the full S&P 500 Index for new trades or just skimming through your favorite watchlists for a three-month trend forecast.
The Seasonality Calendar is a powerful research tool for sure – but it’s just one part of TradeSmith’s groundbreaking suite of Trade Cycles Seasonality and Timing tools.
By harnessing the power of advanced machine learning, our research and development team has built an easy-to-use tool that can review decades of trading data in seconds to find the absolute best days of the year to buy and sell any stock.
Last year, we rolled out a series of major updates to the Trade Cyclessoftware suite – but we’re continuing to improve and upgrade these incredible tools all the time. And our newest additions are so exciting that TradeSmith’s CEO, Keith Kaplan, is going live to spread the word.
Next week, on Tuesday, Jan. 20 at 1:00 p.m. Eastern, Keith will host the Prediction 2026 event to introduce the latest developments in our seasonality research. During the event, Keith will reveal our newest seasonality tool… and he’ll also explore all the ways seasonality can supercharge your investing through the new year.