May 15, 2025: Interview with Jason Bodner (Full Transcript)
Click here to return to the full Inside TradeSmith issue

Click Here to Watch (19:45 min. watch)
Full Interview Transcript
Mike Burnick, Senior Analyst, Inside TradeSmith: Hi again, everyone. This is Mike Burnick, senior analyst for TradeSmith and TradeSmith Insider. Joining me today is a very special friend and guest—our local expert on money flows. You’ve probably seen him before: Jason Bodner. Hi Jason, thanks for joining me today.
Jason Bodner, Senior Editor, Quantum Edge Pro: Thanks for having me. Go Cats! I like your shirt.
Mike: Thank you. Yes, the Florida Panthers are in the thick of the Stanley Cup chase again this year, so here’s wishing them good luck.
Well, speaking of epic battles, we’ve seen one between bulls and bears in the stock market recently, along with some epic volatility. The S&P 500 fell nearly 20%—a rough bear market driven by tariff fears. Even with the recent rally, the index is still down off its peak, but what a recovery it’s been over the last couple of weeks.
So, my question to you, Jason, is: What does your own trademark Big Money Index tell you to expect next from stocks?
Jason: Great question. Yes, we all witnessed that epic 20% drop. Since the trough, SPY has rallied about 17% before today, I think. We’re seeing another big rally today, likely due to the trade news with China.
So all along, I’ve remained qualitatively bullish, expecting resolution on trade, taxes, and interest rates—and so far, that thesis seems to be playing out. But at the end of the day, I just follow the data. It doesn’t really matter what my opinion is.
To your question, let me share my screen. We have a Big Money Index—our proprietary money flows indicator at my research firm, which, by the way, we’re renaming from Map Signals to Money Flows. You’re among the first to hear that.
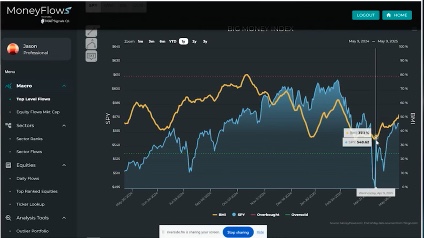
So, what you’ll see here is this amber line mapped against the blue line. The blue line is the SPY. Let’s see if I can get that—there we go. SPY, and then the amber line is basically the money flowing in and out of stocks on a 25-day moving average. So, you can see, obviously, monies were flowing heavily out of the market.
And despite having that huge, massive drop in April, we didn’t actually see the Big Money Index intensify to the downside. Typically, I like to see it go in this green area where it’s oversold, and then I come out and I say, “Hey everybody, I expect a market bottom on April 1st,” which is what I did. If any of you are out there reading my commentary, our data suggested that markets should bottom April 1st—they bottomed April 8th, which is five trading days later, so I apologize. I was off by a week.
But what do you see here? The amber line has been rising. That’s money moving back into the market.
But Mike, to your point—earlier we were talking—it’s not really because of huge inflows. The green lines are inflows, and the red lines are outflows. And you can see peak selling here in April—just capitulation, throwing out the baby with the bathwater. But then that Big Money Index has been rising not because of monstrous buying but because the selling just vanished.
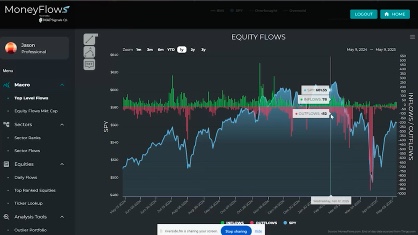
And, you know, we talked a little bit about margin debt and what that meant—margin calls and things like that. So, what the Big Money Index is telling us is that the selling’s gone, the outflows are over, uncertainty is slowly being addressed—especially on a day like today with China and the U.S. pausing their tariff war for 90 days to really get some deals in place.
And markets—I fully subscribe that we’re in a new bull market trend, and I believe we’re going to see new highs before new lows.
Mike: Yeah, well that’s definitely good news. And you could see that just the heavy outflows kind of came in waves there. The first wave down and then the second wave down, which coincided, of course, with the Rose Garden celebration of the big tariffs being put on everybody.
But you’re right. Now we’ve seen, I guess, cooler heads prevail—some good news on the trade front has come out over the last few weeks. And so now we seem to be returning back to normal.
But Jason, you mentioned margin debt and it was interesting—I read in one of your columns recently how a lot of this had to do with a big drop in margin debt, which you kind of pointed to. That’s deleveraging—big funds, hedge fund type people that are just deleveraging massively. And that contributed to probably part of the sell-off, didn’t it?
Jason: Oh, it absolutely did. Interestingly enough—and if I can find it, I’ll share it. If not, we’ll move on to a different day. But historically speaking, there is a huge correlation between margin extended by brokers and stock market prices. And we have done studies—I’ve done studies—going back all the way to the 1990s looking at margin debt statistics. And you can see a very high correlation. If I can find it, I will let you know—this is not it. I’m not going to hunt too much for it.
What you find is it runs lockstep. And as the market goes higher, people are inclined to borrow more money to beat the market. Let’s take last year as a great example. I mean, Mike, I’m sure you had a great year last year.
A lot of people did. The S&P rallied—I think it was 25% in 2024. I mean, that’s great. And if you’re a passive investor and you just put your money in an index fund and you just sit around and wait—well, you don’t really have to do much. You earn a great rate of return.
But imagine you’re a hedge fund manager and you’re charging very wealthy people or institutions high fees to manage their money. You have to justify your existence. So, you’re not going to make any money if you’re making 12% while the market’s having a 25% year.
So, years like last year, where every day—for most days—markets were rising, you’ve got to beat the market and then some.
Most hedge funds charge between 1% and 2% of the money under management as a fee, and then they charge a portion of the profits—you know, as high as 20%, in some cases even more. The guy they modeled the show Billions after, Stevie Cohen—I think he charges up to 50% of profits. So, you really have to outperform the market.
There is one way to outperform the market. Just imagine, in a simple scenario, you stick your money in an S&P tracker like SPY. Well, if you’re charging clients to beat the market, you have to lever that money. So maybe you borrow $1 for every $1 you put in—you lever it up 100 times.
Or, you know, 100 times the money. And you know, instead of making 10%, you’re making 20%. You can justify the fees. So, you can see the incentive to use margin. And when markets are running away—guess what?—margin increases. And brokers keep giving money out. And this is a great way for brokers to make revenue, especially now in a higher interest rate environment than we’ve seen in decades. They charge interest, right? They lend money, they charge interest.
Well, come out in March—and especially April—when Trump made his announcement in the Rose Garden celebration, like you called it, all the brokers have to suddenly change their view. They have to turn around and say, “OK, we weren’t modeling for tariffs this high, and we believe we’ve got to roll back the margin we’re extending to customers, because we think customers are going to blow up, and we don’t want to be left holding the bag.”
And invariably, that’s what ends up happening. So, what you end up seeing is a high correlation of margin debt.
I’m going to put a chart on your screen. This is margin debt since 2020. You can see, as the market falls in COVID in 2020, so does margin debt—these red lines. Market is the blue line. As the market rises, more margin comes into the system. As fear took over in 2022, margin collapsed along with equity prices. And then things recovered, margin went higher, and now with the market collapse, you see a huge reduction in margin debt.
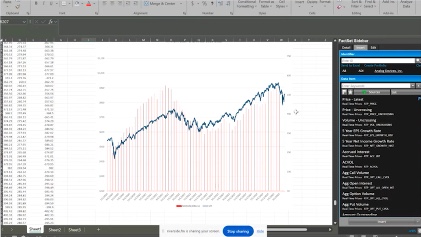
So, in January of this year, margin debt was the highest on record, 937 billion extended to clients. So just think about that.
If you know at bare minimum, you’re gonna take your dollar and at least lever it up 1.5 or even 2 times, we’re talking potentially trillions of dollars in the system, on margin, and by using March’s statistics, we don’t yet have April’s statistics. It was already down to $880 billion.
And we know all the record wreckage was in April, so I fully suspect those numbers will be lower. So I blame a lot of it on margin.
Mike: Yeah, deleveraging, and you’re right, I mean, margin borrowing is the rocket fuel that propels stocks higher oftentimes, and the absence of it causes these sudden market declines, but you know, the S&P 500 recently, more recently had a really rare winning streak for the record books. It was up 9 straight days.
And yeah, I guess a lot of investors might think, well, you know, we’re up for, you know, day after day like that. Maybe the market’s overbought, you know, we kind of missed it, but you went back and wrote that historically, you looked at all the numbers when this has happened in the past and historically, it’s actually been very bullish for stocks going forward, hasn’t it?
Jason: Yeah, surprisingly, I mean, it seems counterintuitive, right? Market goes up day after day. It’s gonna have to revert lower, right? We’re gonna have to see lower prices, but it doesn’t really work out that way.
The statistics we saw going back since 1928, I’ll try and put those up on the screen, make them big if I can.
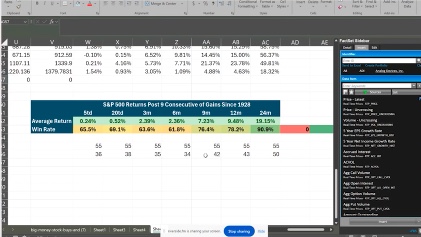
Since 1928, after nine consecutive trading days where the S&P rallies, this happened 55 times since 1928. And you consider there are 252 trading days a year. It’s a lot of trading days. It’s a very rare occurrence, but when it does happen, stocks are up a week later, a month later, three months later, and six months later.
And what you see in the lower column is the percentage of times they were actually up. What gets really exciting is when you look at 9, 12, and 24 months, stocks are up substantially and, you know, between 76% and 90% of the time. So, this is a bullish indicator as rare as it may be.
Mike: Yeah, yeah. So, folks haven’t necessarily missed a boat yet. Now with the 90%-win rate two years from now.
Jason: Not bad. You know, I know I’m betting on higher prices two years from now.
Mike: That’s good, good stuff. So, let’s take a closer look at your Quantum Edge system and what it’s saying about market opportunities now. I remember you writing that right now traditionally Defensive sectors still rank kind of near the top of your Quantum Edge system, including utilities, utility stocks, while the traditional growth sectors like technology, for instance, are a bit weaker than usual. Does that tell you anything about this market environment, or do you expect that to shift here now that we’re seem to be back on the upside?

Jason: Yeah, I absolutely expect that to shift. As a matter of fact, I wrote in this weekend’s, I really sit down and try and unpack the market. The prior week’s occurrences, and what I found was there were a lot of money inflow signals, so as small as those green signals have been, like over here, past couple of weeks, what I noticed in the last week was a significant amount of them were seeing technology inflows.
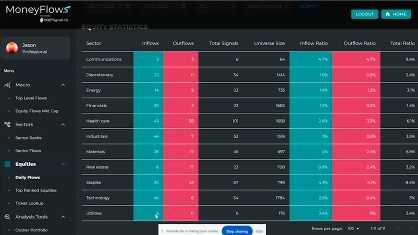
So, let’s just look here since May 1st, for argument’s sake. We can go in and I can show you. That technology saw 46 inflows. Discretionary stocks saw 23 inflows. So, the Defensive sectors like utilities only saw 6 inflows. So I fully suspect that that is changing right now and there are great opportunities in growth stocks, specifically because these tariff pauses, you know, first for the rest of the world and now for China, buys multiple months to get deals underway to take the pressure off of American businesses and really sort of at least temporarily suspend that fear about growth slowdown.
But what it means to me is when we are going to see lower than expected tariffs as it, you know, evidenced by the UK and the trade deal that came out there, we’re looking at largely 10% instead of 25%. I think we’re going to see that type of phenomenon go globally. And then, we all know an interest rate cut is imminent. We just don’t know when, interest rates are gonna fall, and then we know that Trump is really interested in reducing taxes, especially on businesses that invest in America or produce in America.
So, if you take those three factors together, who does that benefit? It really benefits growth stocks. You know, you remove the headwind of borrowing, lower interest rates, you offset that income with tariffs elsewhere that increases trade, that’s gonna remove that headwind and then on top of it all you get lower taxes, that could be like rocket fuel for the bottom line of some of these small and mid-cap businesses which are usually tech and discretionary.
And those are the two biggest sectors for a bull market. Historically speaking, when you get that raging bull market, you want to look up and see it’s being led by tech and discretionary.
Mike: Usually the moneymaker sectors for sure. And, and speaking of which, I know your Quantum Edge portfolio is actually held up very, very well despite the carnage in the market, you know, you were an early holder of Super Micro, for example, which you still have a portion of in the portfolio up 140% or 150%. Other stocks like Tradeweb Markets up 80%. It’s amazing. They held up very well because there’s strong growth stocks, as you said.
But there’s probably a lot of good opportunities in some individual stocks now after, you know, this pullback, the stocks are still down, you know some of them 10, 15%, even just 5 or 10% from the recent highs. Good opportunity maybe to go in and buy some of those higher quality stocks where you’re seeing money flows.
Jason: Yeah, absolutely, and that’s what we’ve been doing in the Quantum Edge Pro service is buying into these difficult times patiently, methodically, and I’ve been looking at something which is rare for me. Usually, so I use something called the quantum score, and we like a nice strong technical score and a fundamental score, and it signifies that the company’s healthy and money is flowing into the stock and it’s trending higher. That gives us a high probability of future price appreciation. That’s how I get my 70%-win rate since 1990.
However, sometimes when markets go haywire, like April and March, you want to look for something called a divergent signal in my data. So, we’re looking for really high fundamental scores and really weak technical scores, and that signifies forced selling.
Let’s go back to margin calls. Your portfolio manager, you get a tap on the shoulder from your risk manager, says, “Hey buddy, Goldman’s calling our margin. You need to liquidate.” So, you got to sell stuff. What are you selling? Your losers or your winners. You usually sell your good stuff, and it’s forced. You have no choice. You got to get it done by the end of the day. You throw out the baby with the bathwater.
So, for us, we look for opportunities like that. Stocks with growing sales and earnings, growing profit margins, really respectable use of debt. And if they’re trading at very low multiples or, you know, trading near three-month lows, even 52-week lows, might be a real opportunity for us to get big, big gains over the future.
Mike: Exactly. Well, we’re excited to see some of your new recommendations coming forward and for all of our viewers or readers today, they can always get more information on Jason’s Quantum Edge Pro by just clicking on the link right at the bottom of this particular article.
Jason, thanks as always for joining me today. Always interesting and educational.
Jason: Hey, listen, thanks for having me. Whenever you want to have me on again, we should do a hockey talk. We’ll just sit around and talk hockey, and we can put it on at like 11:30 at night and if people are tired, you know, they can tune in.
Mike: I’m game for it. Let’s wait till after the Cats hoist that Stanley Cup again and then we’ll do it.
Jason: A repeat! Listen, you and I will go together. We’ll get good final games if that happens. Alright, thanks for having me, Mike.
Mike: Thank you for joining me, folks. Jason Bodner of Quantum Edge Pro. Thanks for joining us and as always, good investing. Talk soon.