Most Nasdaq Stocks Are Not Following the Leaders
Stocks have surged to new all-time highs in recent days. But you would never know it by the small number of stocks that are moving higher, and that’s a red flag.
Last week I pointed out that the S&P 500 Index (SPX) has developed bad market breadth. This happens when the index itself hits new highs, but fewer and fewer stocks within the index make new highs of their own – or are not even rising in price at all.
While the SPX has been hitting new highs, the percentage of SPX stocks making new highs has dwindled to less than 5%. Meanwhile, the percentage of advancing SPX stocks recently fell below 50%, down from nearly 90% in March.
That’s bad market breadth, and it can signal an impending market correction.
Now the same thing is happening to the tech-powered Nasdaq 100 Index (NDX), which has been leading the market higher for the last two years. Take a look.
The chart below shows the Invesco QQQ ETF (QQQ), which tracks the Nasdaq 100, has been hitting new highs, including just yesterday. But in the middle panel, you can also see that stocks hitting new lows (red bars) are easily outpacing the number of stocks making new highs (green):
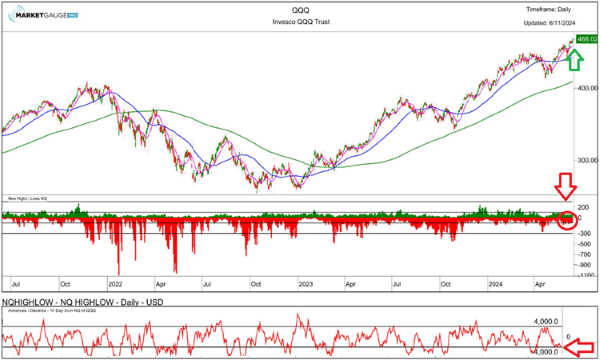
And the lower panel displays the ratio of advancing stocks vs. declining stocks, which has gone straight down since April. The current reading is well below zero, meaning far more tech stocks are falling than rising.
This classic negative divergence tells me that new highs in the Nasdaq are being propelled by a small number of mega-cap leaders, the Magnificent 7, while many more stocks fail to keep pace.
The risk is that sooner or later the stock market leaders will fall down in price with the majority of declining stocks.
Turning to our TradeSmith internal breadth indicators for the NDX, we can see some of the same trends.
As with the S&P 500, our in-depth market distribution indicators for NDX show a much more subtle shift in strength. You can access the Market Outlook features with a subscription to Ideas by TradeSmith, Trade360, TradeSmith Essentials, or TradeSmith Platinum. If you don’t see this option in your TradeSmith Finance platform — and would like to — call 888-623-0858 to discuss.
You can get to these indicators a couple of different ways. From the TradeSmith Finance Dashboard, click on the Nasdaq 100 tile at the top of the page.

Or you can click on Markets in the top menu to view our Market Outlook page, then click on Nasdaq 100 (NDX).
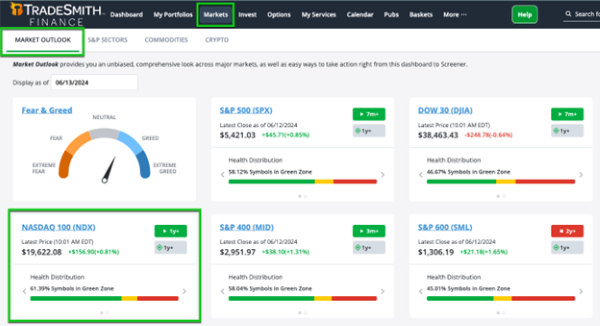
Either path will take you to the Stock Analyzer page for NDX, where you’ll find the Distribution Indicators on the Holdings tab.
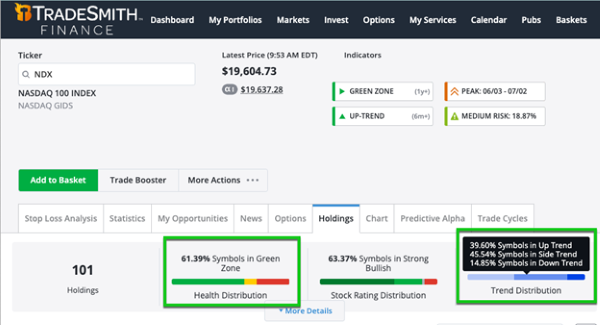
On the plus side, 61.39% of NDX stock symbols remain in the Health Indicator Green Zone, a clear majority. However, the Trend Distribution shows just 39.6% of NDX stocks are in uptrends, while the majority of symbols are in either side trends or downtrends.
The key here is to monitor your stock portfolio very carefully. You should consider trimming any Red Zone stocks and keep any Yellow Zone stocks on a tight leash. And if any of these stocks continue to drop below their TradeSmith Smart Moving Averages,then you may want to tighten your stops.
And speaking of stops, TradeSmith gives you three options: Health Stop, Volatility Quotient (VQ) Stop based on our proprietary algorithms, and a Trailing Stop that you can set at any percentage below your stock’s current price.

Generally, the Health Stop is more aggressive, set at a price closer to the current price. The VQ stop triggers when a stock is experiencing unusual volatility. We recommend a standard trailing stop of 25%, but you can be more aggressive if you update your settings.
Whichever you choose, alone or in combination, just be sure you have a stop price in place for every asset you own.
Mike Burnick’s Bottom Line: I sincerely hope I’m proven wrong about these negative divergences. But based on my 35-plus years of experience as an analyst, money manager, and writer, markets with narrow leadership like this can prove hazardous to your wealth. Typically, top-heavy markets with just a handful of stocks moving up ends badly. The leaders get dragged down in a broad market decline. So, be sure to keep monitoring our TradeSmith Market Outlook page to assess the health and trends of the key market indexes.
Good investing,

Mike Burnick
Senior Analyst, TradeSmith