New at TradeSmith: A Powerful Indicator Based on Two of My Favorite Tools
Our software engineers have outdone themselves again. They recently developed an algorithm that lets us deploy two of my favorite TradeSmith timing tools at once through a single, powerful indicator called the Harmonic Convergence.
That term, Harmonic Convergence, has a number of definitions from the mystical to the sublime. In music, it’s the process of producing a pleasing harmony of sound.
For our TradeSmith strategy, it means combining our proven timing tools – Trade Cycles and Seasonality – with a classic momentum indicator, the Relative Strength Index (RSI), to aim for pleasing profits, both long and short.
So, let me take you on a guided magical mystery tour of Harmonic Convergence. Step right this way.
Simply log in to TradeSmith Finance. Note, the Harmonic Convergence feature is available to Trade Cycles, TradeSmith Essentials, and TradeSmith Platinum members. If you don’t see these tools in your platform — but would like to — call 888-623-0858 to discuss.
Now from the Dashboard page, scroll down, and just below the Predictive Alpha widget you’ll find our all-new Harmonic Trade Cycles Signals data:
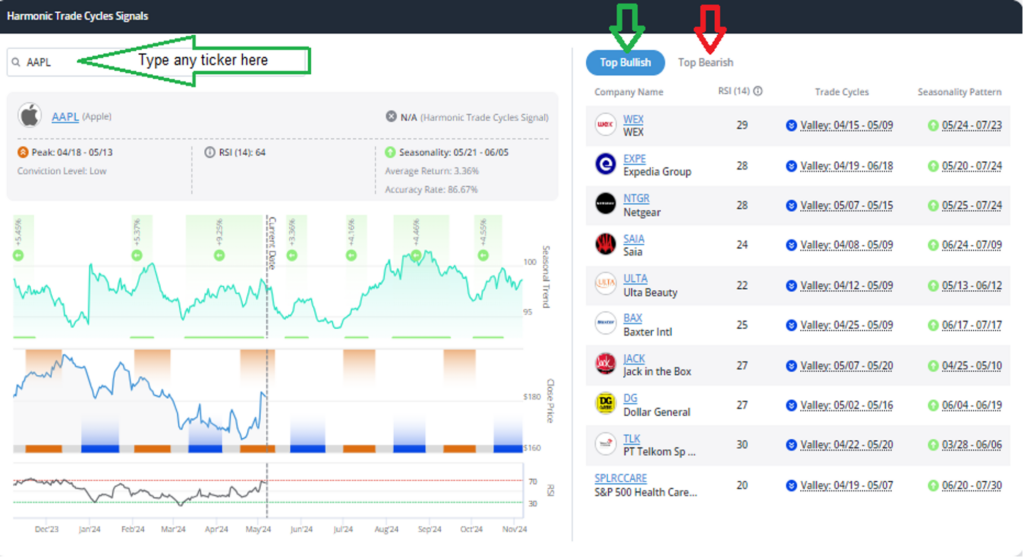
These signals come in two flavors: bullish and bearish. Let’s take a closer look at each.
To find Top Bullish Harmonic Trade Signals, the tool looks for stocks or indexes that meet these three conditions:
- In a Cycle Valley or upcoming Valley, which is a projection that prices will move up from there.
- A high-conviction positive seasonality window coming up within the next 30 days.
- An RSI reading below 30, signaling the security is oversold.
In my screenshot above, you’ll notice the Top Bullish opportunities listed on the right side, 10 in total, along with the three readings that make up their Harmonic Convergence. Simply toggle over to Top Bearish (not shown) to see that top 10 as well.
Top Bearish Harmonic Trade Signals give you stocks or indexes that meet the opposite conditions:
- In a Cycle Peak or an upcoming Peak, which is a projection that prices will move down from there.
- A high-conviction negative seasonality window within the next 30 days.
- An RSI reading above 70, signaling the security is overbought.
Also, on the left side of the screenshot above, you’ll see that you can type in any ticker and the tool will check for Harmonic Convergence on that stock.
Apple (AAPL) is the stock I used in my example above. AAPL has a decent bullish seasonality window from late May to early June, up 3.4% on average. But AAPL is also in a Peak and has an RSI of 64 currently. So, it doesn’t qualify as bullish on those two counts.
The Bullish and Bearish Harmonic Convergence signals have also been added to your TradeSmith Screener tool. And that’s where the real fun comes in.
You aren’t limited to the filters we selected for the bullish and bearish Harmonic Trade Signals. Make it your own by adding any other screener filters that you see fit. The possibilities are limited only by your imagination. Here’s how to go about it.
Once you’ve logged in to TradeSmith Finance, click Invest on the top menu bar.
Next, click the Screener tab just below. Scroll down and you’ll find our TradeSmith pre-built screeners under the list of My Screeners you might have already created and saved in the tool:

Now, let’s click on Bullish Harmonic Convergence and see what results we get.
I got 10 results when I ran this screener. I like to display the Seasonality Patterns and Cycle Conviction columns side by side, as shown below, which you can do by editing your Default View like so:

Note, one thing you may find is that the top bullish and bearish Harmonic Trade Cycle Signals in the Dashboard don’t always match the results from running your own screener.
The top signals are just that… the ones that we have found to be the most accurate seasonal signals.
By clicking on the highlighted numbers in the Seasonality Patterns column, you’ll see the details on the seasonal windows coming up for each stock. Some of these patterns, while still bullish, may not amount to much potential return. You can see what I mean when with Darden Restaurants (DRI), shown below:

DRI has a bullish seasonal pattern from May 24 to June 8 with an 80% accuracy rate, which looks very good. But note the average return over this period is just 1.6%. That’s not much upside.
That’s one reason why I like to tinker with the Bullish Harmonic Screener. And you can do the same.
Add as many other filters as you see fit to take this powerful pre-built screener and make it your own.
Here’s a screenshot that shows what changes I made to the base screener.
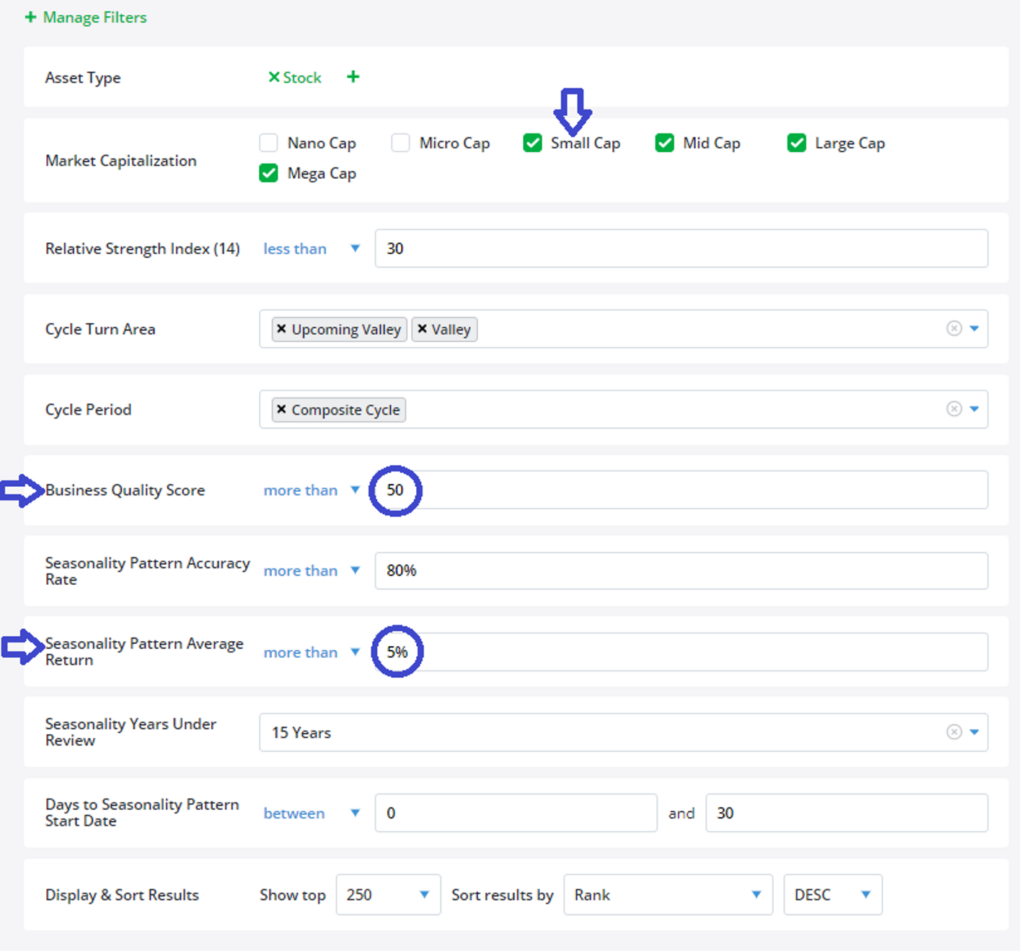
First, I added Small Cap stocks to the mix. There are plenty of small caps that have been public long enough to have established seasonal patterns.
Second, I added another of my personal favorite indicators, Business Quality Score, and set it to more than 50. This gives me a greater comfort level that the results will be high-quality stocks with solid fundamentals.
Third, I took the Seasonality Pattern Average Return up to more than 5%. This way I’m not wasting time reviewing stocks without much upside potential.
And remember, the seasonal patterns we’re searching for are over the next 30 days. If you can make 5% or more in a stock in just a month, that can translate into 60% annualized gains.
I didn’t get many results, just three: Ulta Beauty (ULTA), Teradata (TDC), and Expedia (EXPE). But I can have a higher conviction for these stocks in terms of both their quality and upside potential. ULTA looks particularly interesting.
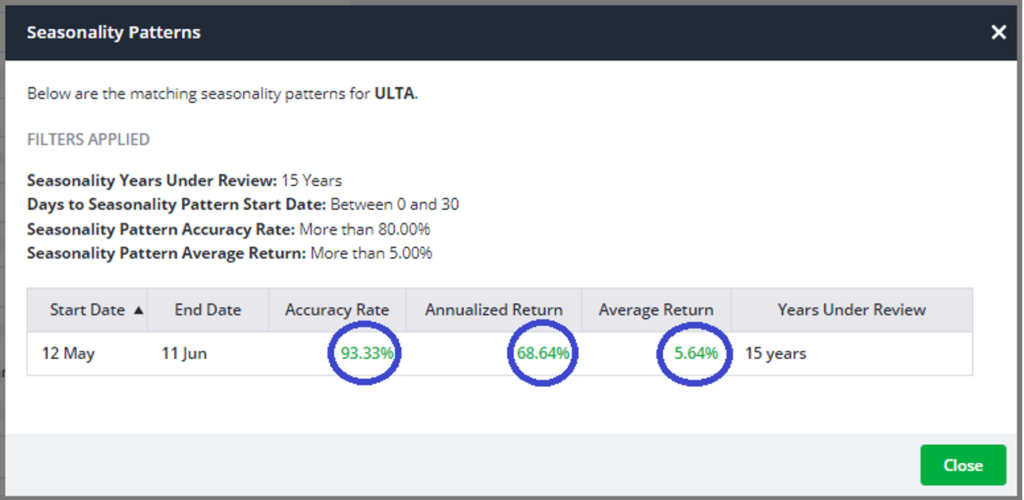
First, out of my original list of 10 screener results, ULTA is the only stock with a Medium Cycle Conviction Level. That means its cycle pattern is more reliable than a low conviction level, giving me extra confidence.
Second, the seasonality stats look great: 93.3% accuracy rate, 5.6% average return over the past 15 years, which translates to 68.6% annualized. Also, this bullish seasonal window opens next week and runs through mid-June: sweet!
Mike Burnick’s Bottom Line: Our new Harmonic Trade Cycles Signals combine the best timing indicators with momentum signals from the RSI into a single, powerful trade indicator, either bullish or bearish. The alignment (Harmonic Convergence) of these indicators can provide you with high-conviction, short-term buy or sell signals. And for my money, it’s a great fit for options traders using our exclusive Options360 tool to find profitable call and put option trades based on these bullish or bearish trade signals.
Good investing,
Mike Burnick
Senior Analyst, TradeSmith