New TradeSmith Tools to Help You Pinpoint High Probability Trades!
Our software development wizards here at TradeSmith are always hard at work enhancing our tools, strategies, and data delivery to help you make money.
And we recently launched several new improvements to our Options360 data.
In a nutshell, Options360 helps you trade smarter by pinpointing high-probability options opportunities using advanced screeners based on return on investment (ROI), probabilities, and more – so you can trade with clarity and confidence.
Options get a bad rap. While they can swing up and down quickly, they can also be highly lucrative if you know the right moves to make. And that’s exactly what Options360 seeks to do: Make options opportunities more accessible and less risky.
The updates to our Options360 platform include new trade evaluation tools and an updated menu of probability metrics, which can help you uncover option trades with greater potential profit.
No matter if you’re an options pro or simply curious about how we make options trading better at TradeSmith, you’ll want to read on…
POP Plus More Probability Metrics You Can Use
When selling a put option to earn income, you typically aim to collect the premium with a low chance of being put shares of the underlying stock (i.e., being obligated to buy the stock at the strike price).
That’s why we calculated POP as the probability an option is out of the money (OTM) by expiration date.
As the put seller, you generally want the option to expire OTM – that means the stock stays above the strike price, and you keep the full premium with no obligation to buy shares.
But that’s not the same as the probability of earning a profit on the trade. For that, you also need to factor in the premium you earn for selling the put.
That’s why we’ve modified our POP calculation to better reflect the true probability of profit. In other words, the probability that the trade is profitable by any amount.
So, if you’ve been using POP as a stand in for probability of expiring OTM – that data is now more clearly labeled Prob OTM.
In most cases, POP and Prob OTM should be close. But there could be some noticeable differences that you should be aware of, as I’ll show you in an example below.
Where to Find (and Customize) Your Probability Data
First, you can locate all our probability metrics – old and new – by viewing the Options Chain tab in Calendar View:
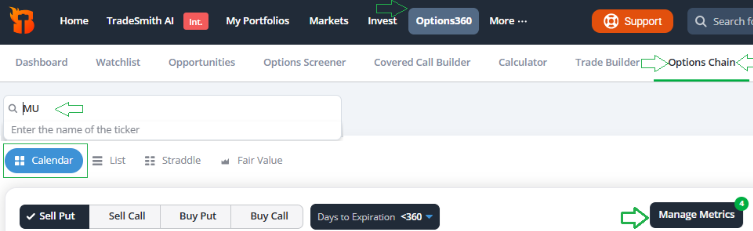
Simply type the ticker symbol for any stock you want to view options for, in this case Micron Technology (MU), and click Calendar view.
As usual, you can select the option type (sell put, sell call, buy put, or buy call) and choose the number of Days to Expiration.
Plus, now you can easily choose the option data you most want to view by clicking the Manage Metrics button shown below.
Please Note: If you don’t see this on your dashboard – and would like to – simply contact our Customer Care team at 888-623-0858 to learn more.
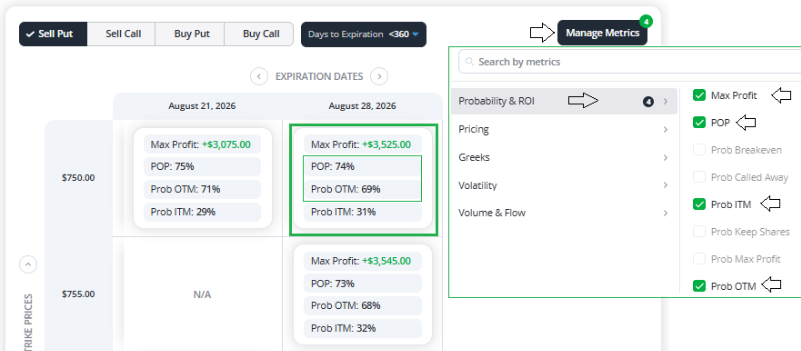
Here you can select up to four data points for your own customized option calendar view, as shown above. For this example, Under Probability & ROI, I selected:
- Max Profit
- POP (Probability of Profit)
- Prob OTM (out of the money)
- Prob ITM (in the money)
There are many other data fields you can choose from as well, including other popular option pricing metrics, the “Greeks,” Volatility data, and Volume & Flow metrics.
Prob ITM is simply the flip side of Prob OTM. This option, for instance, has a 69% Prob OTM, so its Prob ITM is 31% – together adding up to 100%.
Notice right off the bat that there’s a slight difference between POP and Prob OTM:
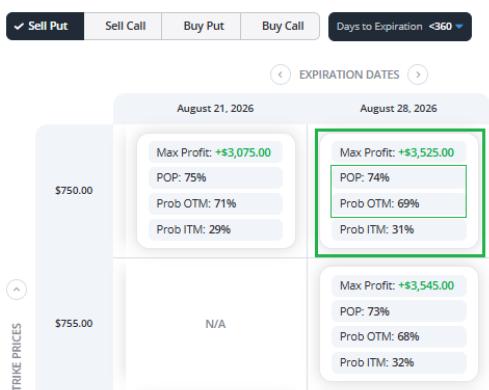
The MU Aug. 28, 2026 $750 Put has a POP of 74%, but the Prob OTM is 69%.
This means there are high odds you will make money on the trade, and only a modestly lower probability the option will be out of the money by expiration.
In fact, according to the Prob ITM metric, there is a 31% chance the option could be in the money by expiration – which is not insignificant.
But that doesn’t mean the trade will be unprofitable.
The difference comes down to how much premium income you receive for selling the option. In this case, that’s $3,525 – or $35.25 per contract, since each option contract covers 100 shares of the underlying stock.
A Closer Look: The Trade Overview Tab
Now let’s dig a bit deeper into this potential trade to see the probability illustrated graphically.
Simply click the selected option in the Option Chain to view the Trade Overview for that option, shown below. Here’s the Trade Overview for the MU Aug. 28, 2026 $750 Put.
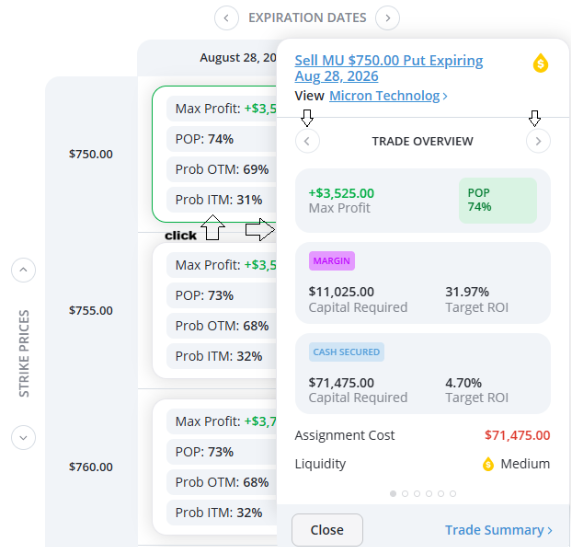
Here you’ll find even more detailed information about this option trade, including:
- Max Profit and POP
- Capital Required for both Margin (using borrowed funds) and Cash Secured trades (setting aside the full cost to buy the shares if assigned)
- Assignment Cost (if you’re put shares)
- The option’s Liquidity, and much more.
Simply click on the left or right arrows at the top of the Trade Overview tab to scroll through all the data calculations and statistics we track in Options360.
This includes one of my personal favorites: the Underlying Asset Price Forecast graph shown here.
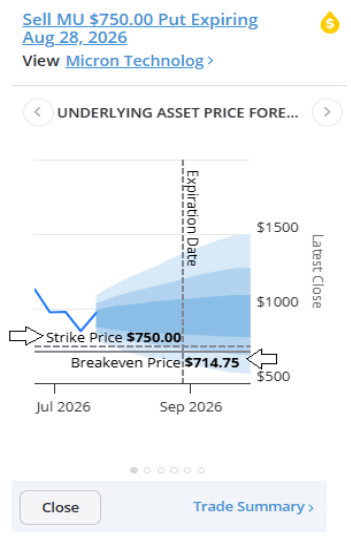
At a glance, it visually shows you the probability of success for any option trade.
The shaded areas represent the probable trend for the underlying stock price between now and the option’s expiration date.
You’ll also see the strike price and breakeven price automatically calculated for you.
Notice the strike price of this put option is $750.
And thanks to the $35.25 per contract of premium income you earned for selling the option, your breakeven price is much lower, at $714.75.
Here’s how it is calculated: strike price ($750) – premium collected ($35.25) = breakeven price ($714.75).
This means the put option can be in the money (below $750) at expiration, and you’ll still earn a profit on the trade – as long as the stock price stays above $714.75!
This gives you a more accurate picture of how much money you can make on the trade and increases your trading flexibility.
Even if the underlying stock trades somewhat below your put option’s strike price, you could still make a nice profit in this trade example.
Just keep in mind that if the stock is below the option’s strike price, you could be assigned. This means 100 shares of the stock could be put to you at the strike price.
In this case, that would be 100 shares of MU at $750, for a total cost of $71,475.
If you don’t want shares put to you, then monitor the stock price. And if the stock moves below your option’s strike price, you may consider closing the trade early.
And our Options360 platform can help you do this by easily setting alerts to be notified if any stock moves above or below a certain price.
Now, let’s move on to another exciting new Options360 tool and give it a test drive.
Quickly Analyze Trade Scenarios
Our new Options360 Scenario Analysis tool helps you evaluate an option trade before you pull the trigger. You’ll find this valuable tool in the Options360 platform by clicking on the Calculator tab, then on Scenario.
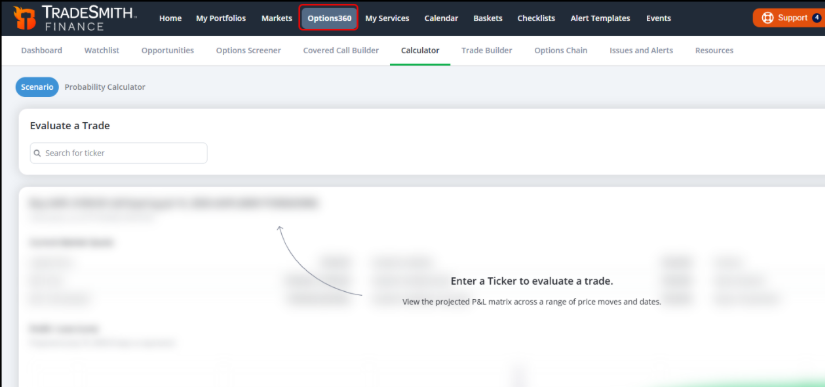
Now you’re ready to evaluate any option trade. Simply enter the ticker symbol for the underlying stock you want to evaluate for a potential option trade.
- Select the trade action: “Buying to Open” or “Selling to Open.”
- Choose the option type (Call or Put).
- Scroll to select an expiration date and to choose a strike price.
Next, define the scenario you want to analyze by specifying the move you expect the underlying stock to make (either up or down) and the future date to evaluate the trade.
Let’s evaluate the previous example trade: MU Aug. 28, 2026 $750 Put.
And we’ll view scenarios if MU moves up or down by 15% by Aug. 7, about halfway to expiration date. Here are your settings:
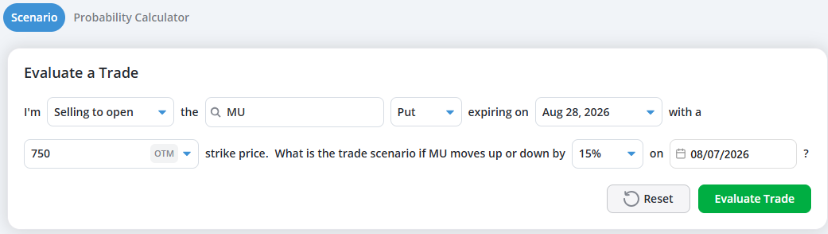
Once your trade details are all set, just click Evaluate Trade.
Options360 will display the key market data for the selected option, including:
- Latest price, bid/ask, and the spread
- Implied Volatility (IV), Rank & Percentile (how today’s volatility compares to its recent history)
- Trading volume and open interest
- Days until expiration
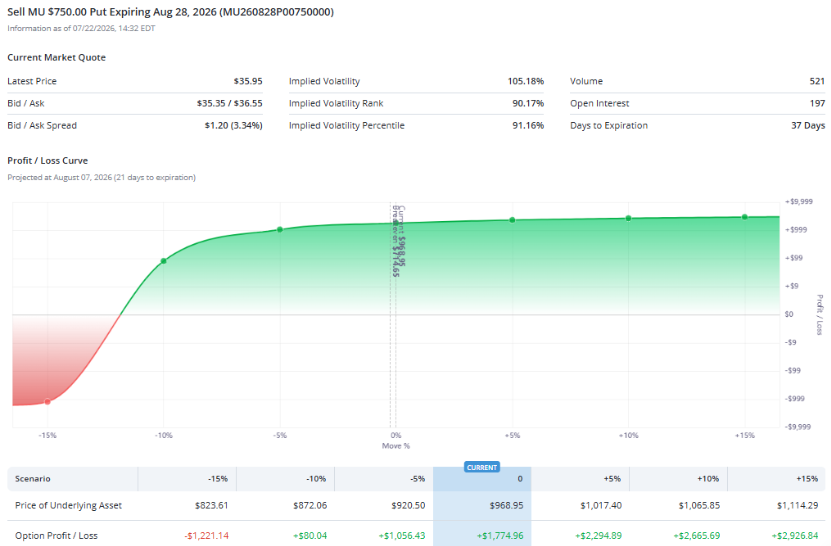
The Profit/Loss (P/L) Curve illustrates the projected P/L for the option based on different price movements of the stock over time. Each point along the curve represents a different percentage move up or down in the underlying stock.
For instance, you can see at a glance that this trade would only go underwater if MU moved down 10% or more in the next few weeks.
The drawdown would grow if MU fell 15%. But if MU stays flat, moves down slightly (10% or less), or rises in price, then this trade should be a winner for you.
The Scenario tool allows you to quickly visualize how the option’s value could change under different scenarios. And that arms you with the right information and valuable insights you need for successful option trading.
Mike Burnick’s Bottom Line: Options360 helps you trade smarter by providing advanced data analytics to pinpoint high-probability options, so you can trade with greater confidence. This toolkit just got a whole lot smarter with additional option metrics and our new scenario tool. And that’s just a few of our most recent enhancements – with much more coming soon!
Good investing,
Mike Burnick
Senior Analyst, TradeSmith
P.S. The new Options360 tools we covered today can help you find high-probability trades. But finding great trades is only half the battle – the other half is knowing when the whole market could turn against you.
AI-driven algorithms now execute the majority of trades on Wall Street, moving faster than any human can react. We saw stocks go from healthy to hammered in a matter of hours earlier this year – and TradeSmith CEO Keith Kaplan believes it’s not over.
I’m sounding the alarm on U.S. stocks in an urgent market briefing. Because if history is any guide, based on more than 100 years of market data…. the next great bear market could arrive sooner than you think.
While today’s bulls are relying on AI to “save” this bull market… Keith believes AI will instead play a starring role in ending it, with drastic consequences for investors left holding the bag when it arrives.
That’s why Keith is stepping forward now, to show you how to time the arrival of the next bear market – down to the month and day. Plus, the #1 move to make with your money, to safeguard every single stock in your portfolio.
If you have access to Options360 to find great trades, that’s a good start. But make sure you’re protected on the downside, too.