
Profit From a Seasonal Stock Slump with Trade Cycles Seasonality Tools!
Editor’s Note: The TradeSmith offices will be closed on Monday, Feb. 17, for the Presidents’ Day holiday. Customer Service will also be unavailable this day, but our regular hours will resume on Tuesday, Feb. 18.
It’s been a topsy-turvy environment for the stock market these past few weeks. After notching a record high on Jan. 23, the S&P 500 Index (SPX) proceeded to fall 3.5% over the course of six trading days. Then it went on to rebound, gaining back 3% in only four days!
That’s enough volatility to give traders and investors whiplash. But we’d better get used to it.
As I’ve mentioned in prior issues, economic policy uncertainty is on the rise – and market volatility along with it. And this joint rise in uncertainty and volatility comes just ahead of a historically weak seasonal period for stocks:
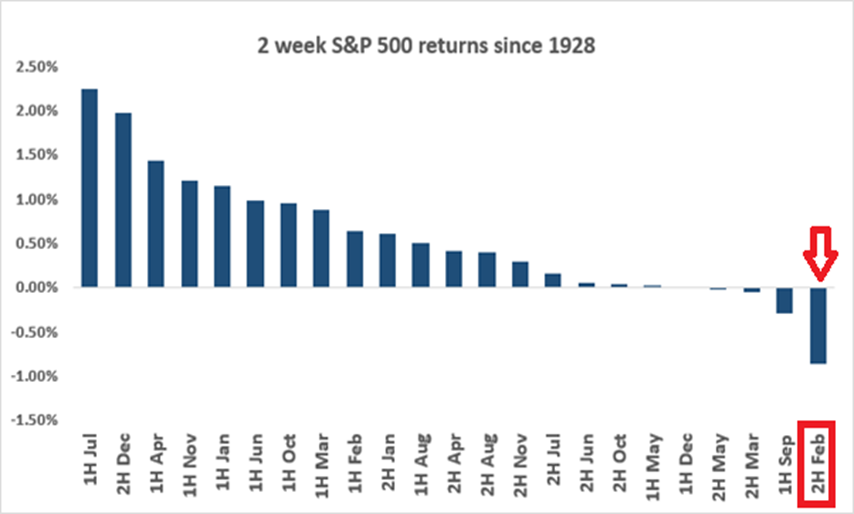
As you can see above, the last two weeks of February have consistently been one of the weakest periods of the year for stocks, with index prices falling 1% or more on average – based on data going all the way back to 1928.
Add this to the fact that stocks are still extended to the upside, after the S&P 500’s big gains of 25% last year, and bullish prospects are slim at the moment.
History shows that, following powerful annual rallies like we saw last year, stocks tend to take a breather. And our exclusive Trade Cycles Seasonality tools can concur – pointing to a bearish seasonal trading window opening for the S&P 500 very soon:
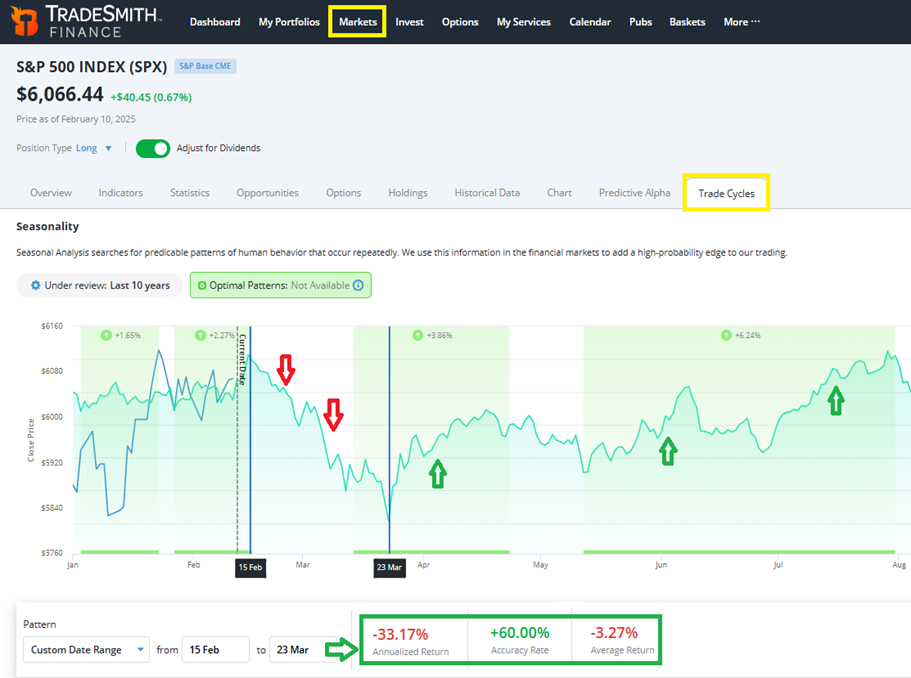
This chart above displays the seasonal patterns of the S&P 500 Index, based on the last 10 years of price movements. And as you can see, we’re about to enter a seasonally weak period on Feb. 15 until March 23.
Over the past decade, SPX has lost an average of 3.27% during this bearish seasonality period, declining over this five-week span 60% of the time.
That works out to an annualized return of -33.17% over the last 10 years. Yikes!
Trade Cycles and TradeSmith Platinum members can quickly review this kind of top-level seasonality data for all the indexes we track, with just a few clicks from their dashboard.
To do so, simply log into TradeSmith Finance, and from the main menu bar at the top click on Markets – then select the S&P 500 (SPX) or any of our other available markets.
Next, click on the Trade Cycles tab at far right of the sub-menu bar, which will bring you to our up-to-date Seasonality charts as shown above.
And if this upcoming period of seasonal weakness does play out this year, as it has in the past, there are ways you can profit from it – all by harnessing the power of our Trade Cycles Seasonality data. Here’s how…
Quick Seasonality Insights Right on Your TradeSmith Dashboard
Individual stocks display their own unique seasonal patterns, just like the larger market indexes. Our proprietary Trade Cycles Seasonality tools scan through decades of historical data to identify these patterns – and we’ve developed easy ways to access them.
Our new Seasonal Edge trading system scans through all of the S&P 500’s component stocks to find those with the most reliable bullish trading patterns. Then it sends seasonality trades straight to your inbox – so you can aim to profit from the upside, all year long.
However, our Seasonality tools can also show you the most bearish seasonal trading patterns for stocks – giving you an opportunity to profit from the downside. And you can find these bearish opportunities right on your Dashboard.
To access these powerful seasonality signals on your TradeSmith Finance platform, simply click Dashboard, then scroll down to the Seasonality window.
From this window, you can use the search bar on the left to review upcoming seasonal windows on a ticker of your choice or review the upcoming Top Bullish and Top Bearish periods identified by our system:

Again, you must be a Trade Cycles or TradeSmith Platinum member to access this data – and this Dashboard window. If you don’t see them on your dashboard – and would like to – call 888-623-0858 to discuss.
By default, you’ll see the Top Bullish seasonal stock patterns displayed in the window. And the security with the most potential upside windows is also displayed automatically on left, below the search bar.
To the right, you can also click on the Top Bearish tab to display securities with upcoming bearish seasonal windows, as shown above.
For each security on either the Top Bullish or Top Bearish lists, we provide all the details about the upcoming seasonal trading pattern, including…
- Seasonality Pattern start and end dates…
- Annualized Return…
- Accuracy Rate…
- And Average Return for the upcoming period.
For example, the first security on the Top Bearish list above is the Direxion Real Estate Bear 3X ETF (DRV). DRV’s upcoming bearish seasonality period starts on March 15 and ends April 9. And its annualized return for this period is a whopping -165.88% – averaging a negative return of -11.36%, with an accuracy rate of 100% over the last 15 years!
Armed with this powerful seasonality data, traders can profit directly from securities that are historically poised to slump lower, as well as those that tend to surge higher. And when we’re looking at an upcoming slump in the markets, that’s a great tool to have.
For securities appearing on the Top Bearish list, you could consider buying put options or put option spreads on the underlying security to profit from a decline. Or to generate income, consider selling call options on these securities if you have existing positions in your portfolio. (Note: We at TradeSmith will never recommend selling naked call options.)
The stocks included in the Top Bullish and Top Bearish lists change frequently as the calendar changes and more historical data filters in. So, be sure to check back to this section of your Dashboard on a regular basis to find new trade ideas before seasonal windows open.
Mike Burnick’s Bottom Line: Keep in mind, seasonal patterns don’t always repeat exactly, even with a 100% historical accuracy rate – but they do often rhyme with what markets have done in the past.
Shorter-term traders can profit from the potential bearish period coming up by closely watching our Trade Cycles Seasonality data and taking trades on bearish opportunities. If you’re a longer-term investor, you can simply wait out the expected pullback… then use our seasonality data to take advantage of a potential buying opportunity during the next seasonal rally period – expected to arrive for the S&P 500 in March and April!
Good investing,
Mike Burnick
Senior Analyst, TradeSmith
P.S. We’ve discussed seasonality – and TradeSmith’s powerful Trade Cycles tools – frequently in recent months. But that’s because I’m still excited about the latest developments in our seasonality research. And with a bearish period set to potentially send the market into a five-week slump, I’m looking to these tools to make the most of it.
This innovative technology identifies the days when stocks enter historically bearish or bullish seasonal periods – for the more than 5,000 stocks in our database.
Last month, TradeSmith CEO Keith Kaplan unveiled Seasonal Edge – our groundbreaking seasonality trading system that sends entry and exit notifications straight to your inbox. Seasonal Edge uses our Trade Cycles tools and algorithms to identify high-probability trades on S&P 500 stocks, based on a strategy designed by our team of researchers to stack wins and outperform the market.
A $10,000 investment in this seasonality-based portfolio could have grown to $85,700, beating the S&P 500 by 99% – while boasting an impressive 83% accuracy rate over 18 years of backtested trading!
If you missed the launch event last month, you can still access the replay – where Keith shared his bold predictions for the market and demonstrated how the Seasonal Edge “green day” strategy is perfectly suited for today’s market environment.