Spot Where the Big Money Is Flowing – Before Everyone Else Does
Assets in Exchange-Trade Funds (ETFs) have exploded over the past decade at a 22% annual growth rate. Today, more than $23 trillion is invested in ETFs, and money keeps flowing in.
Another $1.2 trillion flowed into ETFs in just the first six months of this year, according to Bloomberg. That’s the biggest ETF money flow ever recorded!
One of the largest growth areas is single-stock ETFs – funds that track only one stock like Nvidia – where assets soared from zero to $65 billion in just four years!
Increasingly, big institutional investors – the smart money crowd – are dominating ETF flows to hedge exposure to the overall market and individual stocks.
Introducing the Quantum Edge Database
Our proprietary Quantum Edge database tracks all these money flows into the major indexes, sectors, and right down to individual stocks, so you can quickly spot where institutional money flows are moving.
We recently updated our Quantum Edge page – adding new data and features including the Quantum Edge Command Center – so you can see where the big money is flowing more easily than ever.
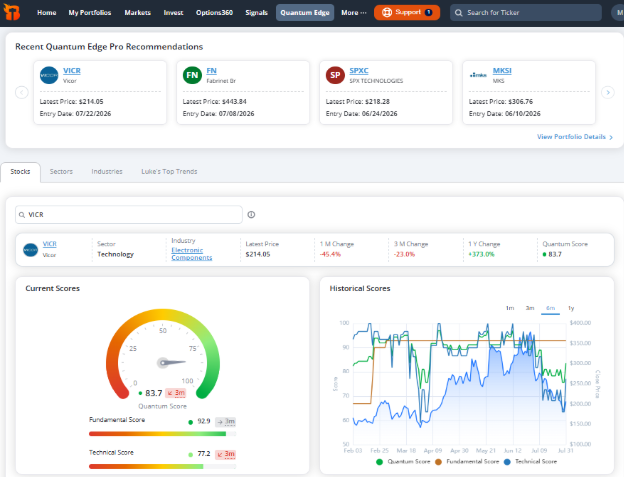
Understanding the Quantum Score
The Quantum Edge system measures stocks and sectors using state-of-the-art technical indicators, fundamental metrics, momentum signals, and big-money flow activity.
The result is a single, easy-to-read Quantum Score. Like a grade on a test, the higher the score, the better the stock.
For example…
- Quantum Scores in the 90s = Excellent (A-grade), head of the class.
- Quantum Scores in the 80s = Good (B-grade), passing the big money flow test.
- Quantum Scores in the 70s = Above average (C-grade), but not ideal.
- Scores under 70 are below average, with room for improvement.
Stocks with the highest overall Quantum Scores display the best of both worlds: strong fundamentals and technicals. These stocks are poised to consistently outperform the market – and often deliver fast-paced gains.
With that background in mind, let’s take a closer look at the Quantum Edge data and how you can use it to prospect for winning trades.
Inside the New Quantum Edge Command Center
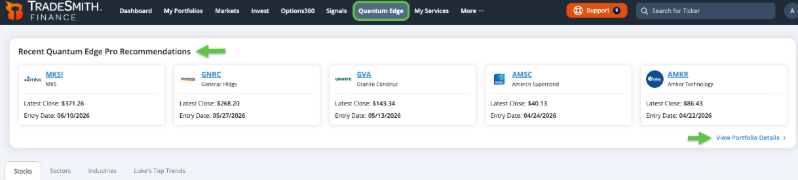
Right at the top, you’ll notice a new banner displaying recent recommendations from Quantum Edge Pro analyst, Lucas Downey.
Please Note: Only Quantum Edge Pro subscribers and TradeSmith Platinum members have full access. But if you don’t see this when you login, simply call us at (866) 385-2076 or email us at [email protected] to learn how to get Quantum Edge access.
You can click on the View Portfolio Details link at the lower right of the banner to access the full lineup of stock picks from Quantum Edge Pro.
Scrolling down the Quantum Edge page, you’ll also find valuable new features, including:
- Stocks
- Sectors and Industries
- Luke’s Top Trends
Let’s take a deeper dive into the valuable data in each section of Quantum Edge.
- Stocks: Look up Quantum Score data on any stock rated by the Quantum system by simply typing the ticker symbol in the lookup box.
At the right, you’ll find the Historical Scores graph for the stock. This is one of my favorite features, because it shows you at a glance how the stock’s Quantum Scores have changed over time.
For instance, let’s take a closer look at Mueller Industries (MLI), a current holding in Lucas’ Quantum Edge Pro portfolio.
A Closer Look at MLI
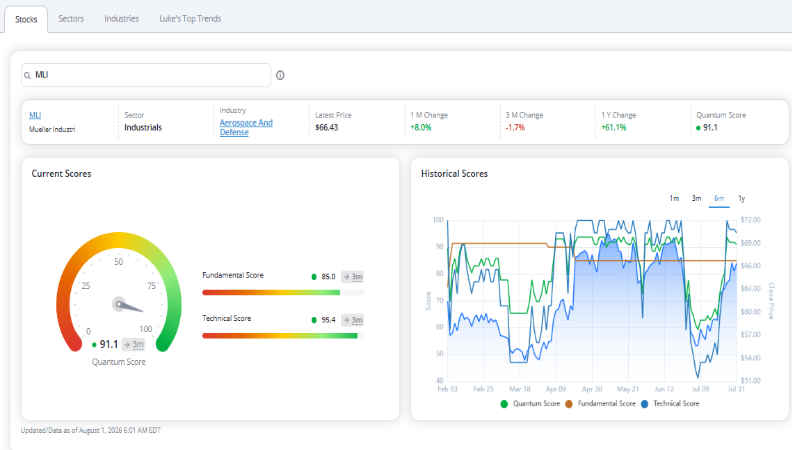
Simply type the ticker symbol into the search box, in this case MLI, and you’ll get the current and Historical Quantum Scores.
Currently, MLI has an overall Quantum Score of 91.1, shown above at left. This number consists of two supplementary scores, the Fundamental Score (85) and Technical Score (95.4), both very strong readings.
As you can see in the Historical Scores chart on the right, the Technical and Quantum Scores made a quantum leap recently.
Hover your mouse over the historical scores graph, and you’ll see how the scores change over time. Technical scores fluctuate quite a bit along with the short-term stock swings. Fundamentals don’t tend to change much.
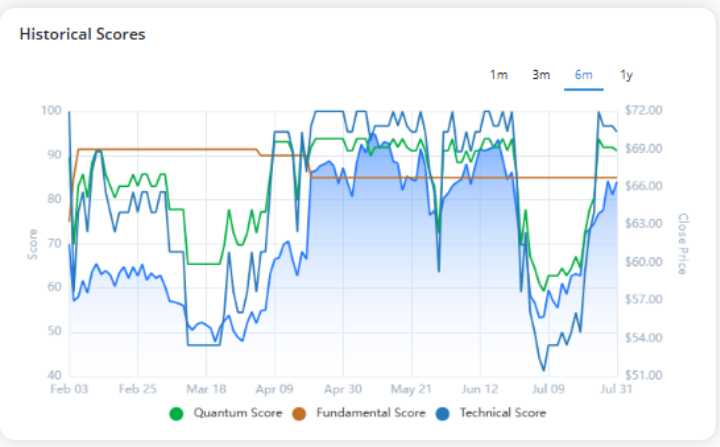
Note that the technical score for MLI has improved in recent weeks, boosting the overall Quantum Score, with both now in the 90s.
This tells you the MLI trends have improved, attracting more big-money inflows. And that’s exactly what you want to look for in a stock poised to surge higher!
Explore Even More Data with Quantum Edge
On the new Quantum Edge page, you’ll also find additional data tabs, including:
- Sectors and Industries: Here you can view current Quantum Score data by individual sector. Right now, Energy, Financials, and Technology have the highest average scores.
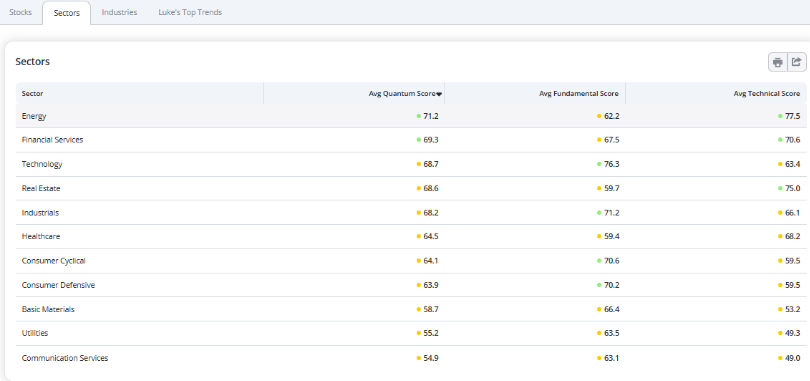
Scroll down a bit further and you can evaluate the individual Industry groups within the sectors by Quantum Score.
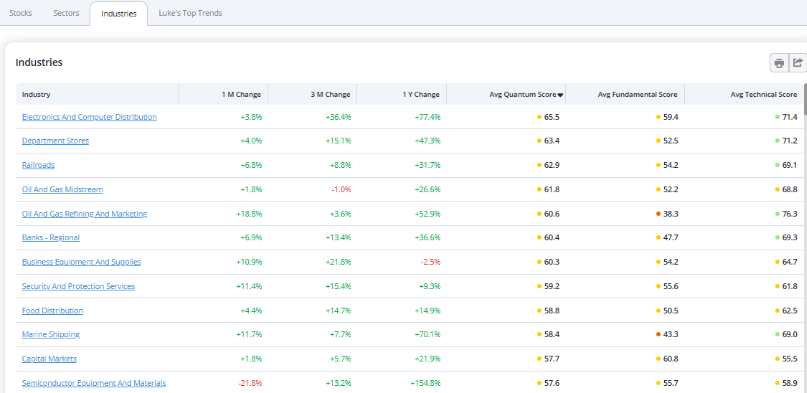
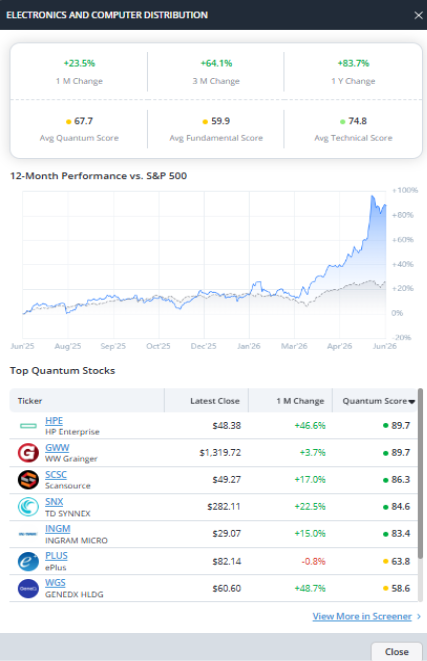
Simply click on any of the highlighted links in the Industries column to get more detailed data on stocks with the top Quantum scores in each industry, like Electronics and Computer Distribution, shown below.
- Luke’s Top Trends: Another valuable addition to Quantum Edge gives you an exclusive look into the hot trends and themes that Lucas has identified as big potential moneymakers.
The key trends currently include:
- AI Infrastructure
- Grid & Power
- Memory & Storage
- Photonics & Optics
- Robotics & Physical AI
As with the Industries tab, here you can view the Quantum Scores for stocks that qualify for each of these key trends.
Simply click on the More Details tab to view the Quantum Scores for the stocks in any of Luke’s Top Trends, such as AI Infrastructure shown below.
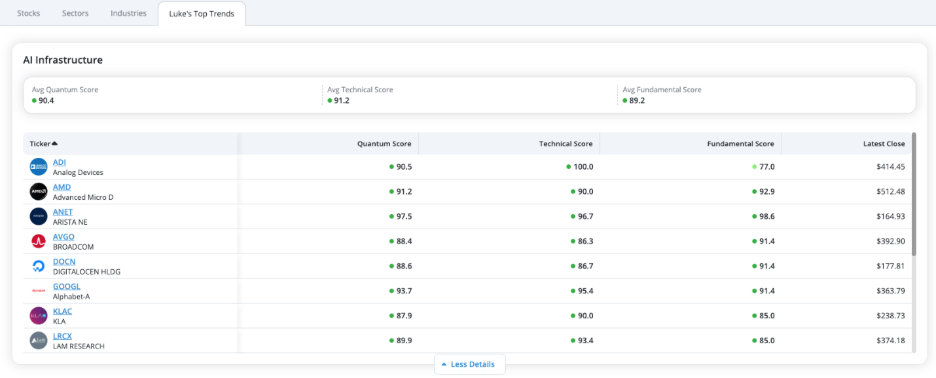
And to uncover more TradeSmith proprietary data and analysis on any of these stocks, simply click on the blue highlighted ticker symbol link in the left-hand column.
Mike Burnick’s Bottom Line: The Quantum Edge system uses a proven combination of technical analysis, detailed fundamental metrics, and the all-important factor of big money flows. Stocks with high Quantum Scores are expected to outperform the stock market. And the new Quantum Edge Command Center page is your hub for the whole Quantum Edge Pro experience.
Good investing,

Mike Burnick
Senior Analyst, TradeSmith
P.S. Now that you’ve seen how the Quantum Score flags stocks like MLI while they’re already in motion, there’s a bigger signal Lucas is watching right now – one that only shows up once every 417 days.
Spotting where the smart money is moving is only useful if you know what comes next. And nobody on our team does that better than Lucas Downey, editor of Quantum Edge Pro.
Before building Quantum Edge, Lucas spent eight years on Wall Street handling institutional stock and ETF trading – and saw firsthand that the game isn’t fair. The investors who win big aren’t smarter than you. They’ve just found the roughly 4% of stocks that drive nearly all the market’s long-term wealth. Everyone else is fighting over the scraps.
These days, Lucas is convinced we’re closing in on a rare setup. Historically, this pattern has kicked off some of the biggest runs in what he calls “Blue Zone” stocks: a rare cluster of companies whose underlying makeup gives them a real shot at 1,000% gains.
He’s circling Thursday, Aug. 27 as the next likely trigger, and bracing for more volatility before that window opens. With AI creating new millionaires faster than at any point in market history, Lucas believes the standard models Wall Street relies on will keep missing the early moves – the exact gap his Quantum Edge system is built to close.
He’s opening free access to his new Top Trends Dashboard so you can watch it work, plus handing out two free stock names.