
Talking Seasonality with William McCanless
Last week, TradeSmith CEO Keith Kaplan shared with me some interesting feedback from a Platinum customer…
“Keith, I’m a huge fan of TradeSmith, but this recent difference of opinion between Mike Burnick (February and March: Look out below!) and William McCanless (all green lights) has me frustrated. Which is it? Two people evaluating from the same data set offering two entirely different interpretations. Is it truly about removing the emotion and trusting the data? Or is it all about interpretation of the data?”*
*Edited for privacy.
I thought this was a really great point – and apt, too!
You might know William McCanless as the mastermind behind Trade Cycles and the sensational Seasonal Edge trading research services. But if you don’t, he’s a powerhouse analyst with tons of intriguing insight – and when he talks, it pays to listen.
William and I decided to sit down for an insightful conversation about seasonality and the different ways we interpret data – and how to approach the increasing volatility we’re seeing in the market.
So, without further ado, let’s dive into the full interview with William below:
Click Here to Watch (18:55 watch)
After our conversation with William focused on seasonality patterns and how they shape market behavior, there’s another critical pattern emerging in the market as we speak…
And it’s not one we’ve seen in the past year, five years, or even 10 years. In fact, we haven’t seen since the Clinton Administration – over 20 years ago!
But what makes it special? After all, there are tons of patterns to take advantage of in the market this year, as we discussed with William earlier.
Well, the last time this pattern formed, it sent a specific class of tech stocks soaring, according to our backtest, like…
- 9,731% when a leading software company spiked from $1.21 to nearly $120…
- 28,894% when a computer-driven hardware firm rode this pattern sky high…
- And more.
As you can see, these aren’t your run-of-the-mill 5-10% gains every year; these returns can be transformative. Even a $5,000 investment in the first stock mentioned could’ve turned into nearly $500,000 at its peak.
We don’t know when this pattern could occur again, but if it takes another 20-plus years to form next time… I can’t say I’d blame you if you were kicking yourself for not hopping on it now.
Go here now for details on this crucial pattern – and don’t be one of the ones left behind this time.
Good Investing,
Mike Burnick,
Senior Analyst, TradeSmith
Full Interview Transcript with William McCanless below:
Mike Burnick, Senior Analyst, Inside TradeSmith: Hello everybody, I’m Mike Burnick, a Tradesmith analyst, and the writer behind Inside Tradesmith. With me today is William McCanless, our expert at all things cycles and seasonalities. Hi Will, how are you today?
William McCanless, Senior Analyst, Trade Cycles: Good, how are you doing?
Mike: Good, thanks for joining me. I know there’s a big-time difference since you’re over in Asia, traveling to learn the secrets of seasonality from the folks in Thailand and China, right?
William: Learning up in the mountains, the secrets of the cycles.
Mike: Seeking enlightenment about seasonality!
Good for you! We wanted to get together today because a reader of ours, a TradeSmith Platinum member – Rob, wrote in about our difference of opinions between Will and I about seasonality. He expressed frustration that two analysts, working with the same data, could arrive at different interpretations. He asked, “Is it truly about removing emotion and trusting the hard data, or is it all about interpreting the data? Please enlighten me.”
Speaking of enlightenment. So, we wanted to get together to talk about this. Recently, I wrote an Inside Tradesmith article cautioning about the last two weeks of February. Looking at data going back to 1926, as a matter of fact, the last two weeks of February are actually the worst two-week period of the entire year since 1928. Of course, seasonality doesn’t always repeat exactly every year. Your opinion is a little bit different about where we go from now until the beginning or middle of March. But I think we’re both in agreement that we may see a dip coming up after that. So, let’s explore this further. Will, tell me what you see in the data and some of the correlation studies you’ve done to get to the bottom of this?
William: Yeah, just real quick, is it all about hard data or interpretation?—the answer is yes to both. The fact of the matter is that two people can look at the same data and look at the same stock – one can be long biased and one could be short biased based because maybe their looking at different timeframes, maybe they have different risk management style, or maybe they express their ideas with different assets. This diversity is what makes a market.
I encourage everyone to read all the Market Master’s books by Jack Schwager. Just every single one from beginning to the most recent one. And you’ll see in there wildly different perspectives on the market. And in fact, he’ll interview people over the years where they were trading the same big trades at the same time, in the same years, and they all had completely different opinions on it, yet still made money.
So, I think what frustrates a lot of people is the fact that trading and investing is half data analysis and half interpretation. So it’s like art and science, and people want this mechanical buy or sell system every time. The issue is that like there just isn’t one. You can get as mechanical as you want, but there’s always the aspect of your personality, your risk management, and everything else.
So the answer to that is yes.
Mike: Yeah, you know, well, that’s just a great explanation.
And by the way, that Market Wizard’s book by Jack Schweger – it’s actually got two of them that he wrote, a must-read for any of our members out there, any platinum members that don’t already have that book on your bookshelf as I do back here, myself. Make sure you get a copy.
But you’re absolutely right—no indicator, whether RSI, MACD, or seasonality, works 100% of the time, but it can give you clues about which way to lean in the market, long or short.
So, if you come into the market looking to make a trade just blind without any indicators at all, then basically you’ve got a maybe fifty-fifty shot of success or less. What we do is we use tools like RSI, for example, or our seasonality, our Tradesmith cycles to put the odds more in our favor. And if you can get a slight edge, even if it’s only increasing the odds to 60 or 70%, you’re really doing yourself a huge favor.
And that’s really what it comes down to. It comes down to trusting the data, but also interpreting it based on what’s going on in the here and now today, you know. So, I know you wanted to share some data that you got from, you know, the monks up there in the Himalayas about correlation studies to kind of get deeper into this and show us what you’re talking about here.
William: Yeah, can you, can you see my screen all right?
Mike: I can see it perfectly well. Yes.
This is good stuff, folks. You’re getting an in-depth, master’s type course here in seasonality from the master, Will McCanless himself.
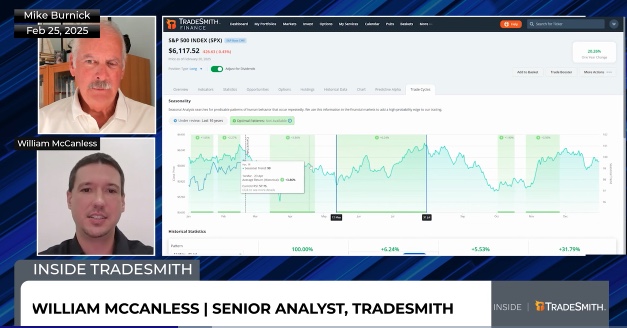
William: So, what you did was you looked at 10 years, right?
And what you saw essentially was from about here, which is about February 15. To basically down into March 23, you’ve got this bearish period over the last 10 years. -2.3% average return, 60% of the time it goes down over the last 10 years – 6 out of the 10 last 10 years.
You also say that you basically look back into the 20s and that this last two weeks of February plays out pretty well. And that makes sense.
So what I do for seasonality is I look at three things mainly.
The first is I’ll look at all years. This is just kind of the difference. I’m going to show you but, what you’re gonna end up seeing is that we more or less line up.
So first, I look at all years. The reason I look at all years is I want to get a big all-year picture. I want to look at the average through a bunch of different presidents, a bunch of different Fed policies, a bunch of different economic environments and geopolitical environments and wars and everything else, everything that I can look at, all that data, big bird’s eye view.
So, the first thing I do is look at the full-year seasonality and you can see that from February 15 into February 28, you’re right, there’s that 0.8% average return, so negative, 0.7%, and it goes down 57% of the time for the last 75 years from February 15 to February 28. And I actually told my subscribers, I’m not going to trade any stocks until around like March until there’s a more bullish period.
Mike: Yeah, I remember you saying that and writing that recently.
William: We went short wheat, we went short gold, and we went long Bitcoin. So I’m just staying away from them right now. And this is part of the reason.
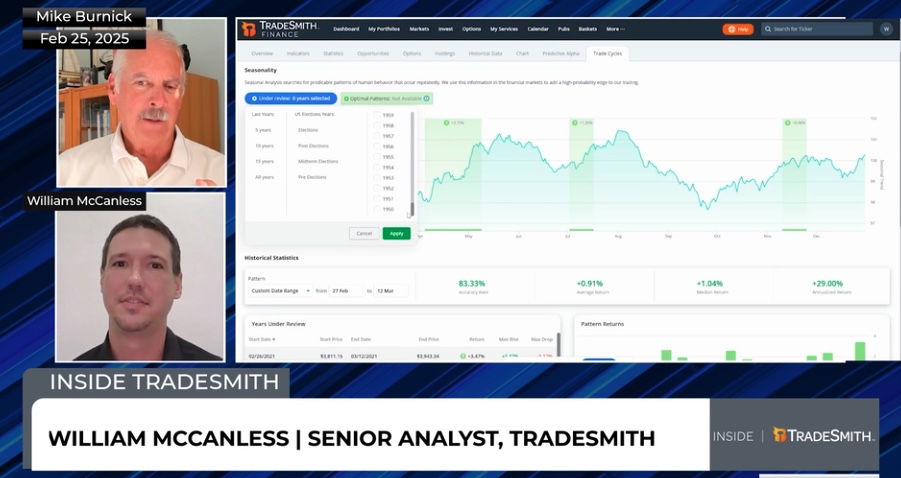
But here’s the thing. So, this is all years, that’s good. But then I want to look at two other things. The next one is the election, the U.S. election year. So, you’ve got four periods on the U.S. election years. It’s called the presidential U.S. election seasonality cycle. Elections, post-election, midterms, and pre-elections.
The next thing I like to do, after I look at the all-year, is right now we’re in a post-election year, so I’ll look at the post-election.
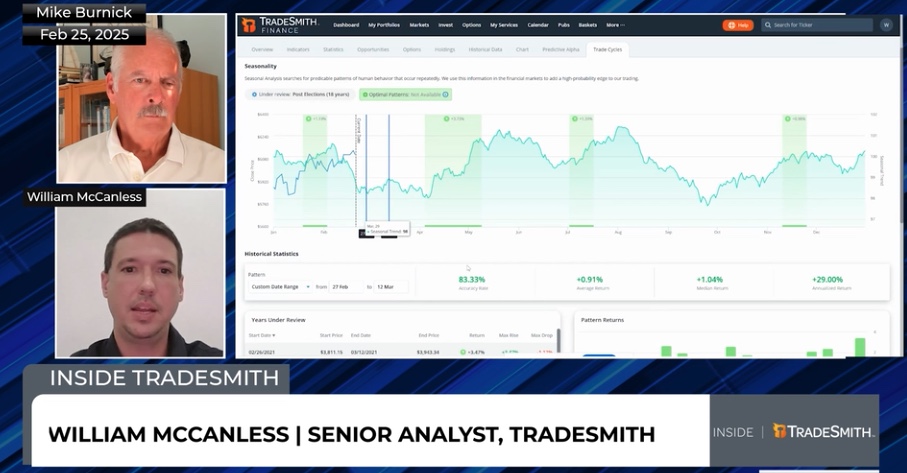
Over the last 75 years we’ve got 18 post-election years right, so what do we see? We see from that same period where you’re starting February 15 to February 21, yes, there is that average drop in this case 1.7%, and it drops to 72% accuracy, but there’s a pop here.
Small pop from about the end of February into March 12, and that pop is 83% accurate on post-election years with a 0.9% average return.
Now, here’s where I played in. Here’s the third thing – we don’t have this on TradeSmith yet –we’re working on it. It will be there soon. But another thing I like to look at is I go all the way in the past, and I want to know what years from the past correlate at 90% or more with our current price action on S&P 500.
Mike: It’s another whole layer of analysis.
William: It’s a whole different layer, yeah. And so, what we’ve got here is we’ve got 1929, 1937, 1944, 1946, 1951, and so on. You see all these years are 90% or more correlated with the current price action.
Mike: In other words, those are the years that are most similar to the patterns we’re seeing so far this year with the S&P, right?
William: Yeah, and I update these weekly. So basically, every week on Friday, I look at, you know, because the correlations can change and shift, but sometimes they can stay the same for months.
For example, for the last six months, there’s been a lot of years from the 90s that have been 90% correlated with current price action. That’s held up for the last six months or so. So it can last a while.
Mike: That’s interesting, that’s both good and bad, I guess. If we’re very correlated with the 90s, especially the late 90s, then we’ve got more upside ahead in this bull market. But then that’s upside that might be leading to a peak at some point, like 1999, 2000.
William: It’s super interesting. In fact, sometimes if I see a large cluster of years like that, there’s like six or seven years out of the 90s where it’s highly correlated like that. I’ll look at just that to see what’s happening.
In fact, I wrote a report when I saw that. I was like, it’s the 90s again, and we actually went short and then long and nailed a short and a long based on that 90s correlation. But anyway, so every Friday, I look at these correlations, and basically what it’s telling me is from Monday to Friday that week. In the past, here are the years that 90% or more correlated with the daily price action on the S&P 500. So, let’s average that out. Here’s the third thing I do. I average that out.
So let’s start, we can go from 1951. OK, so we got 1956, 1962, we got 1965, and then we go into the 80s, which was always fun. 1986, the year I was born, then 1987.
And here we got our 90s cluster again, 1990, and then you got 1994, and then you got 96, 97, 98, and then 2000, which I would consider still in the 90s. Then we got 2007, 2014, 2015, 2018, and finally 2022. And I apply that.
Mike: Now again, these are the years in history that are most similar to the patterns we’re seeing in the stock market right now, correct?
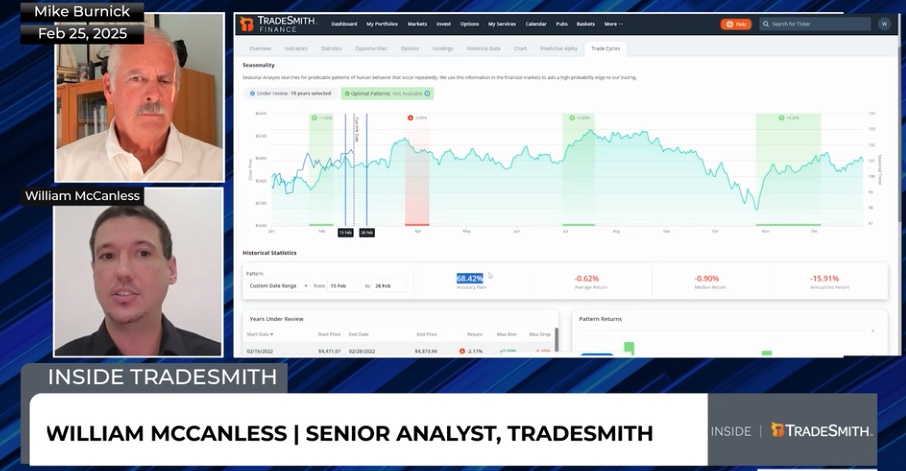
William: Yeah, basically the day-to-day price action of this week as of today, Friday, the day-to-day price action of the S&P 500 this week is 90% or more correlated with those years, if that makes sense.
So now we’re at the same spot, and what do I see? From February 27, you’ve got your same drop here from February 15 into about February 28. It’s the same drop. It’s almost the same, 0.6%.
This is 19 years, by the way, 0.6% average drop, almost 70% accuracy. So, all that holds true.
So your 10 years, your all years, your post-election years, and the 19 years of 90% correlation seasons all line up with your idea of the last two weeks of February being pretty bearish.
The only thing that I saw was that on post-election years and the 90% correlated years, there was at least a small brief pop from the end of February into the middle of March. In this case, 60% on post-election years, it’s around 80%. It’s small. On post-election years, it was 0.9% average return. This one’s 0.7%.
So, when I see a situation where all years may not line up with it, but I’ve got at least two of my other filters that do—so if I’ve got two or more, sometimes it’s all three, sometimes it’s just two, but if all three or at least two line up together seasonally, I will prioritize that seasonal window.
So basically, we’re looking at the same thing. The only difference is that all I see is a brief bullish period from the end of February into the middle of March, and then what? Again, on all of those time frames, all three of them, there’s the same from basically mid-March until the end of March—it’s bearish more or less.
So, the only thing that I told my subscribers was essentially, we’re not in stocks. Because we were online, you and I basically agreed in our independent analysis that the last two weeks were not favorable, so that’s why I was like, we’re not even gonna trade stocks.
And then I told them the only time that I’m gonna be looking for a long is basically the end of February to the middle of March, and then I’m bearish again until we get into April. So, it lines up pretty well.
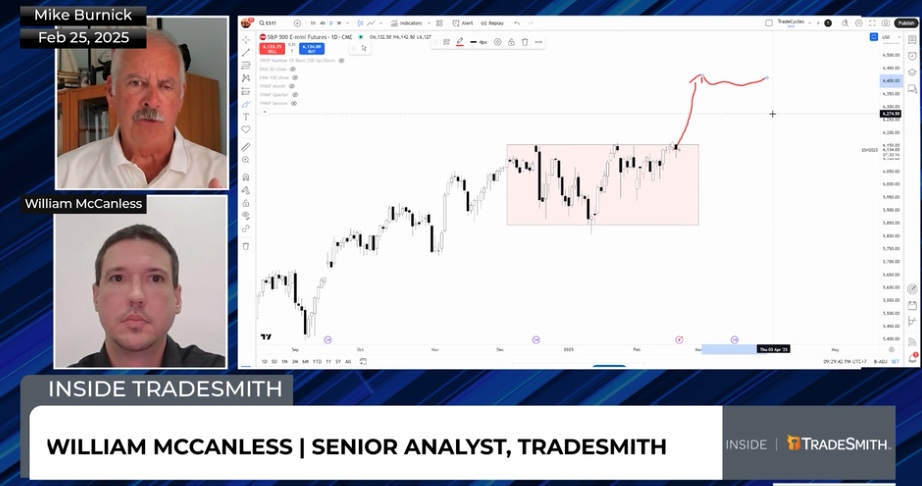
The only other reason I was bullish from the end of February into March was simply because of the price action. If I just get rid of all these squiggly lines, I just saw that the S&P 500 was in a consolidation area.
I thought that potentially it could break out of here maybe at the end of February before consolidating again for the more bullish period, which starts at the end of March.
Mike: That’s interesting. With the correlation chart you just showed—those 19 years. Can you bring that back up? Do you still have that on your screen?
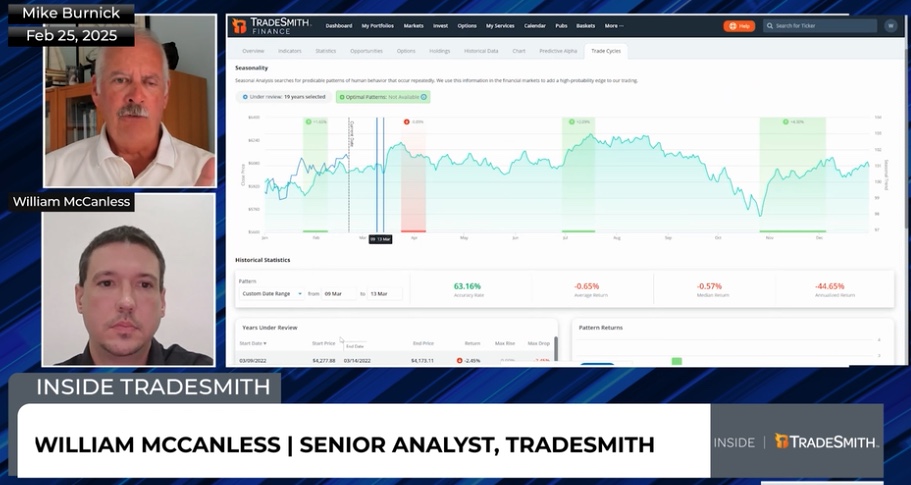
Yeah, you know, from this big picture view, and again, folks, these are 19 years in the past that are most closely correlated—that is, they’re very similar so far with what the S&P has done this year.
Now, as Will pointed out, this could easily change going forward. Every week, you have to redo the correlation studies, as Rob said.
But here’s the interesting thing—you do see that little rally coming right here in this period, then a down period.
What is that, in March? I believe it is, right?
William: Yeah, this would be from March 24 to April.
Mike: So you get that little rally, then you get a consolidation, and then look at the choppiness you get all the way into the summer and then, you know, a little bit of a down stretch coming later in the summer leading into the fall.
So, if this correlation holds up with these 19 years in the past, we could be in for kind of a choppy ride this year.
William: And it’s interesting because we’ve been doing the Trade Cycle service since about mid-2022. And so, over the last couple of years that we’ve been doing it, most of our gains have come in two periods. It’s definitely not the beginning of the year.
Most of them come when we start shorting around July, September, and August. We usually go short on some high flyers, and then we start getting mega long at the end of October.
For example, this last year, we had a big dry spell at the beginning of the year. We were barely trading, and I’m kind of barely trading now. We put on some positions and took them off really fast, and they were good gains, but I’m really slow with it because of this choppiness.
Then when you get into that late summer period, there’s that obvious bearishness that’s worked out really well for us. And then you get into October, and we went with like 6, 7, or 8 positions, and they all worked out. 50, 60, 70—some of them were 100%.
And so that’s kind of the way it goes. Typically, seasonality, you have these brief bumps that all kind of line up—March to April.
But honestly, the last two years that we’ve been doing this, and seasonally almost every year, the beginning of the year into summer is tricky. It’s really tricky.
Mike: And it is this year. I mean, just look at the last week—we had a series of new highs in the S&P, and then yesterday, Walmart came out with disappointing guidance and the market tanked.
So, it’s been up and down and up and down. And I think the main point, which you really bring a lot of clarity to, Will, is that you’ve got to pick your spots.
Buying and holding all year, you can just get chopped up. You really have to pick your spots when seasonality is really favorable.
So, in a nutshell, folks, that’s basically how we use our seasonality data to take advantage of potential buying opportunities that come up in different parts of the year.
Will, thanks for sharing your insight. I love that correlation study. I can’t wait till we add that to the product full-time.
William: It’s gonna be awesome when it’s in there. It’s going to be really great to basically look at all the other years – are they 70,80, 90% correlated.
Mike: Well, again, thanks for sharing, Will. And folks, I hope you enjoyed this deep dive into seasonality. I’m Mike Bernick and Will McCanless, saying so long for now.