This Real-Time Indicator Shows Stocks SKEWed to the Upside
In two of last week’s Inside TradeSmith issues, I pointed out that investor sentiment stinks right now.
In fact, markets have recently flashed bearish extremes from several reliable sentiment indicators. However, when everyone and their mothers are bearish… that’s usually bullish for stocks. That’s the definition of a contrary indicator.
Other indicators based on real-time trading data are not considered contrary but can also signal when market extremes have been reached.
The CBOE SKEW Index (^SKEW) is one of these real-time indicators… And currently, it’s humming a bullish tune of its own.
The SKEW Index was created by the Chicago Board Options Exchange (CBOE) in the aftermath of the “Black Monday” stock market crash, which appeared to come out of nowhere in October 1987.
SKEW readings are calculated in real time, using out-of-the-money S&P 500 option prices to estimate the stock market’s current tail risk. This contrasts with the more commonly known CBOE Volatility Index (VIX), which is calculated using at-the-money options prices.
So, while the VIX measures near-term market volatility, SKEW signals the risk of unexpected extreme events – like the 1987 crash.
The SKEW Index has helped alert investors to the subprime loan crisis of 2008, the COVID market crash of 2020, and the 2022 bear market – as SKEW readings spiked just before each of these major market downturns:

And as you can see above, SKEW readings spiked last month, just before the S&P 500 and Nasdaq 100 Indexes fell into correction territory.
Sudden spikes in the SKEW Index to very high levels can warn you in advance of potential unexpected market risk, making it a useful indicator to keep tabs on. But it’s not just useful as an early warning for crashes: When SKEW falls back to “normal” low levels after spiking, it tends to signal that all’s-clear in the stock market for the foreseeable future.
And as you can see above, SKEW flashed that signal very recently.
After spiking above 180 last month on trade war fears, SKEW returned to its typical lows around 130 two weeks ago. That was just before the S&P 500 flashed back-to-back 90% upside breadth signals.
According to analysis by SentimenTrader, when the 13-week rate of change in SKEW falls below -15%, that’s considered a buy signal for stocks – with the S&P 500 up at least 80% of the time two months later:
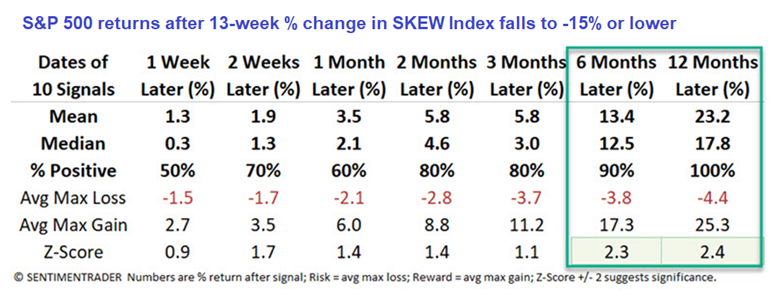
And the S&P has delivered impressive results after this SKEW indicator flashed in the past, especially six- and 12-months later – with average returns of +13.4% and +23.2%, respectively!
Granted, SKEW is just one indicator, which isn’t foolproof as a standalone buy signal. But for my money, this is more solid evidence that stocks got extremely oversold, sentiment got too bearish, and that the odds of stock market gains are now nicely skewed to the upside!
With that in mind, I went back to the well to put together a particularly detailed TradeSmith screener to help uncover likely buy candidates primed to benefit from this upside skew.
Make the Most of Upside Skew with a New TradeSmith Screener
For this upside-inspired screener, I wanted to include some of the best data indicators and analysis TradeSmith has to offer. While the SKEW Index’s latest readings are encouraging to see, we can give our new trades a higher chance of success with the hedge-fund level research and tools that TradeSmith members have at their fingertips.
Here’s a screenshot of the screener settings, featuring our Low-Risk Runners strategy:

To set up this screener for yourself, log in to your TradeSmith Finance dashboard.
From your dashboard, click on Invest from the main menu bar, then select the Screener tab, followed by the green + Create new screener button. Finally, click on + Manage Filters, to apply the following screener filters.
From the TradeSmith Strategies dropdown menu, select Ideas Lab, then scroll down to select Low Risk Runners from the list.
Set Business Quality Score to more than 75%. This will limit our results to the top 25% of stocks we rank by quality.
Projected Price Change pulls from our AI-driven Predictive Alpha stock price forecasting system, and you’ll want to set the search for more than 5%. This will find stocks expected to rise 5% or more over the next 21 trading days.
And to make the most of our exclusive Seasonality timing model, featured in our Trade Cycles service, choose Seasonality Pattern Accuracy Rate and set it to more than 75%. This will limit our results to those stocks with only the most consistent seasonal trend patterns.
For Seasonality Pattern Average Return, select more than 10% to find stocks with especially potent seasonal results, and set the Days to Seasonality Pattern Start Date option to less than 60 days to find stocks ready to rise in the near-term.
Be sure to select Save As New to add this screener to your list of easily accessible searches, then hit the green Run Screener button to run your search.
The star of this screener is our Low Risk Runners strategy – which uncovers stocks that have already started solid uptrends and then pulled back in price, but still have plenty of room to move higher in price from there.
These stocks must have recently moved from the TradeSmith Health Indicator Yellow Zone, back up into the Green Zone, while being in an up- or side-trend.
And our Business Quality Score (BQS) filter ensures that we’re looking only at quality stocks – that, thanks to our Predictive Alpha forecasting and Seasonality timing models, are both projected to rise at least 5% higher in the next 30 days!
When I ran this screener yesterday, I got 49 results, with the top five shown below:
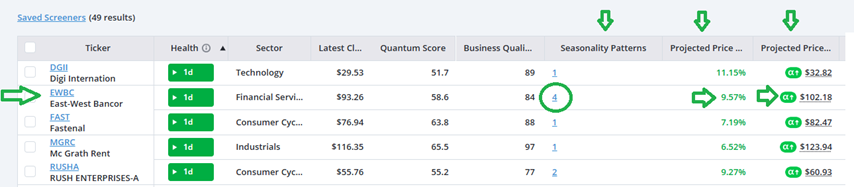
Simply click on the highlighted icons in the column labeled Seasonality Patterns to get more details on the bullish seasonal windows identified by our Trade Cycles Seasonality system.
For instance, East-West Bancorp (EWBC) has a seasonally bullish pattern running from April 20 to July 4 during U.S. post-election years. EWBC stock has been up 100% of the time during this period in the past,posting average gains of 17.19%!

In the next two columns to the right in our earlier list of screener results, you’ll find details on the Projected Price Change (1-month) and the specific Price Projection for each of our stock results. For EWBC, our Predictive Alpha model is forecasting a 9.57% gain in price to $102.18!
And you can certainly aim for greater or fewer results by adjusting these filters or adding more filters of your own. For example, you can screen for higher or lower Predictive Alpha projected price changes and/or fine-tune your desired Seasonality pattern average returns.
Mike Burnick’s Bottom Line: You can use a robust stock screener like this at any time, to find new potential buying opportunities no matter the market environment – not just after a stock market pullback.
Although, when indicators like the SKEW Index flash the all-clear, that can be a great time to look for new entries. Be sure to use my template above to create and save your own TradeSmith Super Screener using the filters you like to use the most.
In fact, send me an email at [email protected] to let me know what screener filters you like to mix & match!
Good investing,
Mike Burnick
Senior Analyst, TradeSmith
P.S. To come up with the Super Screener we built to find new opportunities today, I selected filters pulled from the full breadth of the powerful research, tools, and strategies offered by TradeSmith.
From our stalwart Business Quality Scores to our cutting-edge Trade Cycles Seasonality tool, we’re always working to develop and refine data-driven methods to inspire and empower traders and investors like you: It’s why we’ve poured millions of dollars into our AI-powered Predictive Alpha algorithms, and why our Ideas Lab strategies are some of the most innovative you’ll find.
But here at TradeSmith, we’re not content to sit and rest after a new release. In all our years of history, we’ve always strived to offer more – and as we celebrate our 20th anniversary in 2025, that’s not changing anytime soon.
In fact, we’re less than 24 hours away from revealing some of the biggest developments in TradeSmith history.
At 10 a.m. tomorrow, March 26, our CEO Keith Kaplan will go live with The Big Reveal – a blockbuster event where we’ll be announcing upcoming changes and upgrades that will affect you – no matter if you’re a new follower or a longtime member.
Keith will be giving away top-tier products like Options360, Predictive Alpha, our new Seasonal Edge trading system, and more – all through an unprecedented anniversary offer only available to event attendees.
No matter your subscription level – or even if you’re just along for the ride – what Keith has to say tomorrow morning will have a huge impact on you.
From huge upgrades to new, world-renowned additions to TradeSmith’s dream team of research analysts…
You’ll learn how to get all their research services and recommendations at no additional cost.
And you won’t need to worry about setting an alarm: You can save your spot for Keith’s announcements right now – and get exclusive content to digest while you wait for the big event.
Click here to sign up automatically for this monumental event. You won’t want to miss it.