
Top Stocks for the $10 Trillion Cybersecurity Opportunity
Just a few months ago, healthcare giant UnitedHealth Group (UNH) was hit with a massive ransomware attack against its payment processing arm, Change Healthcare.
UNH paid a ransom of $22 million in bitcoin to a Russian cybercrime group, but that’s peanuts compared to the total cost the company incurred as a result of the incident.
Change Healthcare processes more than 15 billion transactions per year, covering nearly 40% of all medical claims in America.
The cyberattack left many health care providers, hospitals, pharmacies, and more unable to process prescriptions or get reimbursed by insurance. More than a month after the attack, UNH was beginning to process a massive $1 billion backlog of claims.
By the end of the first quarter, UNH had shelled out $3.3 billion in expenses to resolve the data breach, plus advances to help keep small and mid-size medical practices afloat.
And that’s just one recent story of a big American business getting held up by cybercriminals. Regrettably, the cybercrime spree is rapidly rising.
Cybercrime costs big business trillions of dollars. As for smaller firms, it threatens to put them out of business entirely. But it’s also created a huge, multi-year growth opportunity for the stocks that are best positioned to fight cybercrime.
The cost of cybercrime is projected to reach an astonishing $10.5 trillion a year by 2025. That’s more than triple the $3 trillion cost of cyberattacks reported in 2015.
Just to put that in perspective, $10.5 trillion in yearly losses to cybercrime is more than three times the combined losses from all natural disasters worldwide last year, which was a record $301 billion.
That figure is plenty big enough to get Wall Street’s attention. But sadly, it’s American small- and mid-size business owners down on Main Streat, the foundation of our economy, that suffer the greatest damage from cybercrime.
More than half of all cyberattacks are committed against small businesses and 60% of them fail within six months of falling victim to a hack or data breach.
Naturally, big bucks are being spent on cybersecurity worldwide, as you can see below. And it’s created a generational gold-rush opportunity for stocks in this sector.
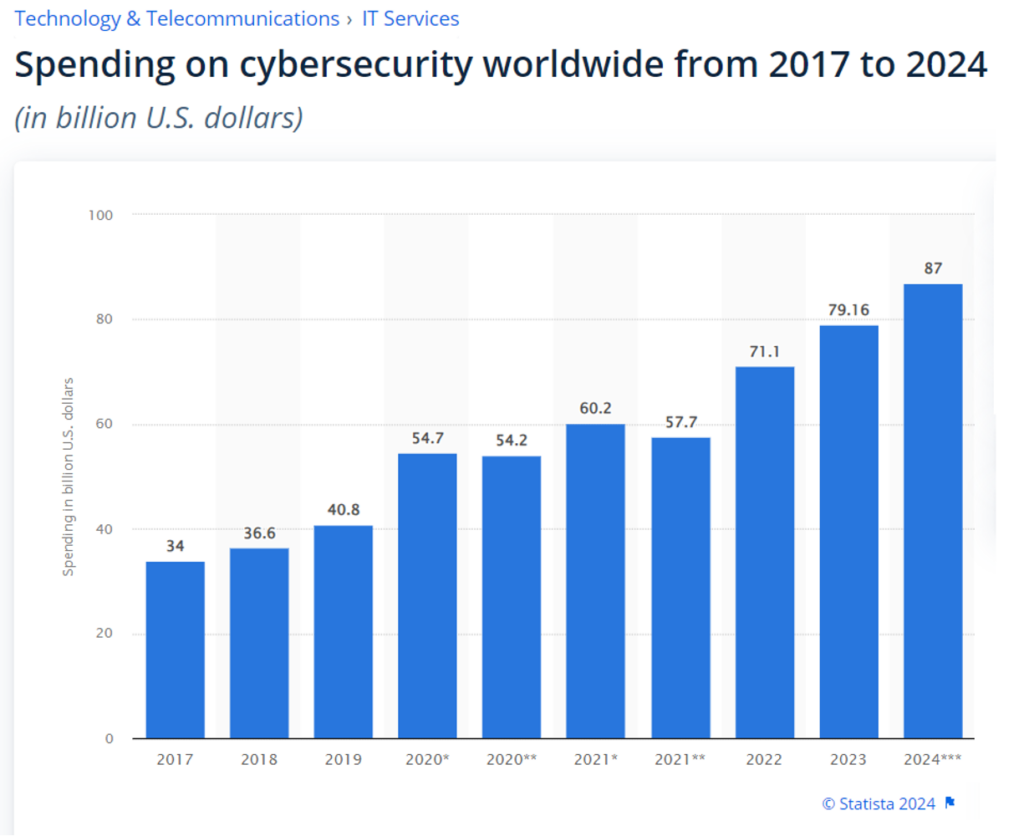
Spending on cybersecurity software and system improvements has nearly doubled since 2019, on track to reach $87 billion worldwide this year.
And when in a gold rush, there is often a higher probability of profit in selling picks & shovels to the miners, instead of trying to stake a claim and mine for the yellow metal yourself.
That’s exactly what leading cybersecurity stocks are doing today. And the First Trust Nasdaq Cybersecurity ETF (CIBR) includes 26 top cybersecurity stocks. To get good industry-wide exposure to cybersecurity spending growth, you could just buy the ETF and call it a day.
But I want to dig a bit deeper and use our TradeSmith Finance tools to see which stocks earn the highest marks according to our system. Here’s how to do it in five easy steps.
How to Find ETF Holdings
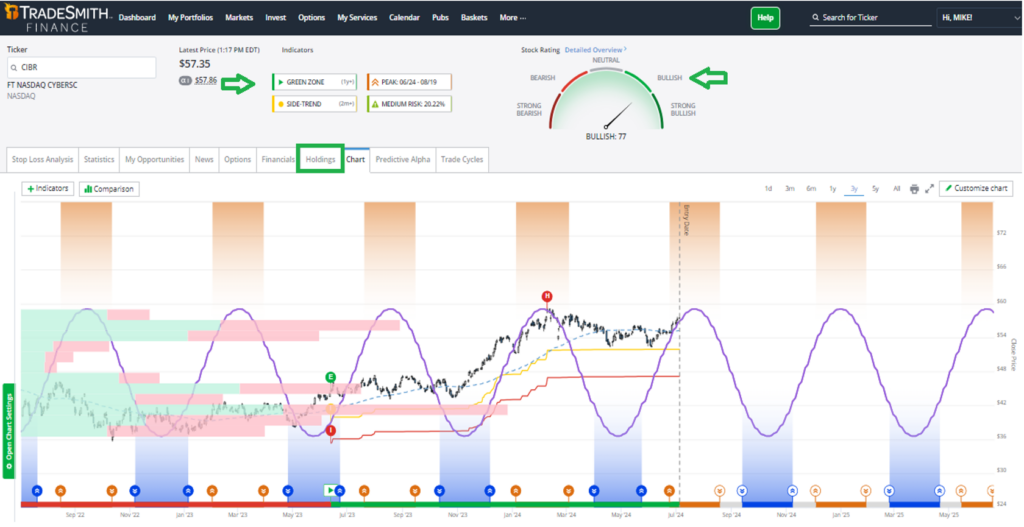
First, be sure you are logged in to your TradeSmith Finance platform. In the Search for Ticker box at the upper right, enter the ETF ticker symbol CIBR. This will bring you to the main page and chart for CIBR. Note that CIBR is in the Health Indicator Green Zone and has a TradeSmith Rating of Bullish.
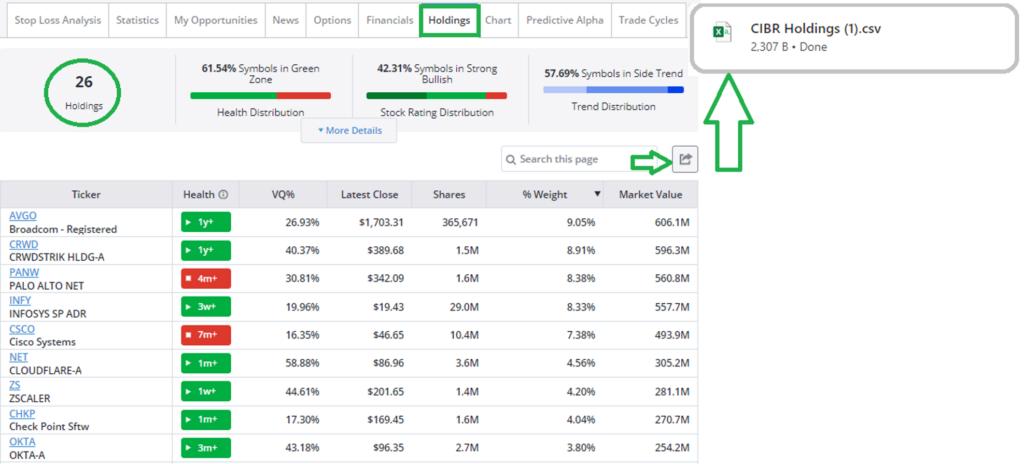
Next, from the tabs bar just above the chart, click on Holdings.
This will open the page below showing you all the ETF holdings and some basic details for each component stock, including our TradeSmith health grade, VQ%, and number of shares held by the ETF.
5 Steps to Great Stocks
Step 1: You can quickly and easily export the holdings list into Excel to create a portfolio watchlist for more in-depth analysis or to set alerts. Simply click on the Export icon shown above at right. That should open a dialog box on your PC or Mac telling you the file has been exported.
Open the Excel file on your computer and copy the ticker symbols only (shown in column B below), with no other data. That’s the only info you need to create a portfolio watchlist in TradeSmith Finance.
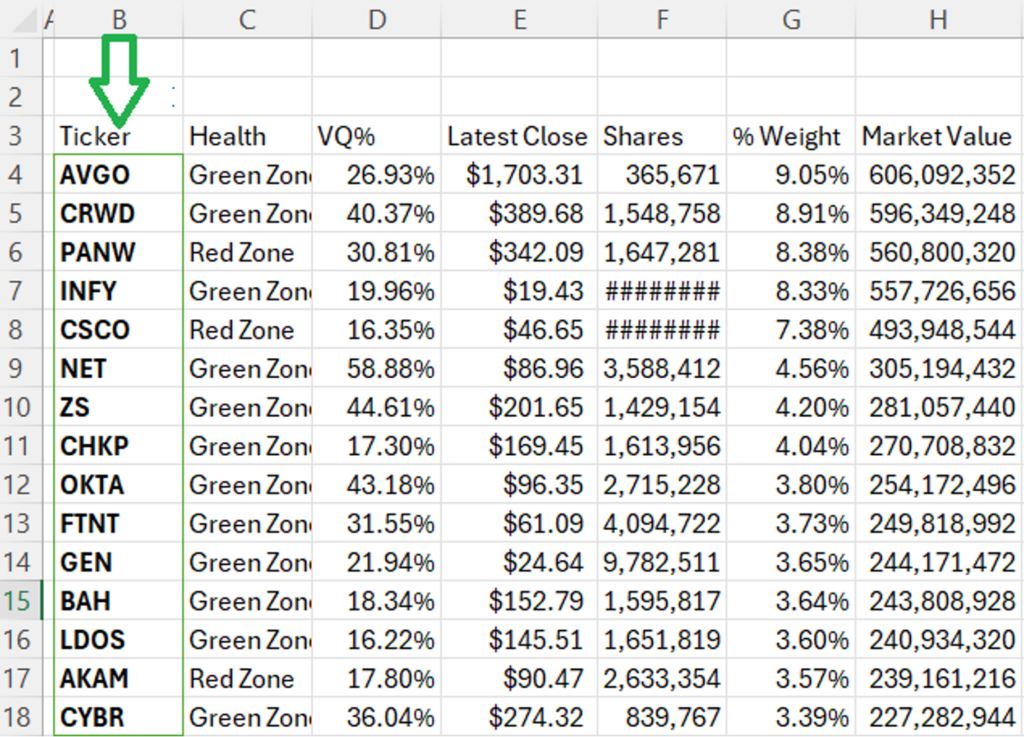
Step 2: Now, open a new blank Excel workbook and paste only the ticker symbols into the new workbook. Then save it as a CSV file (comma-separated values).
Step 3: Next, go back to TradeSmith Finance and navigate to the My Portfolios menu. Then click on the Manage tab, select from either an Investment or Watch Only portfolio, and then click + Add Portfolio as shown below.
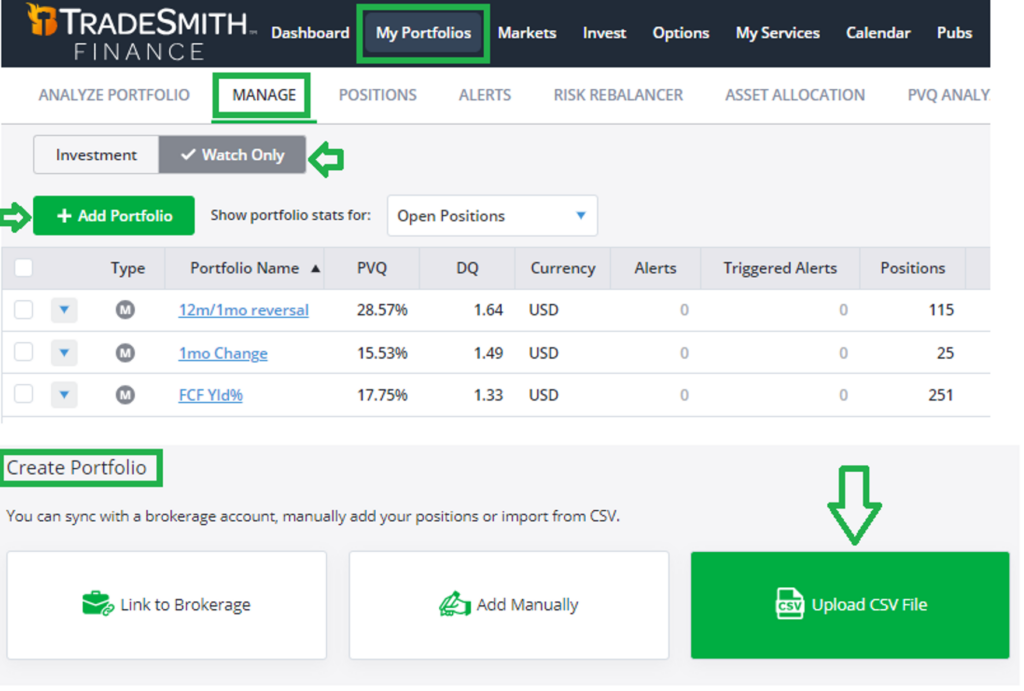
That will open the Create Portfolio dialog box shown above. You can click on the green Upload CSV File button at right to easily import all the tickers automatically. Alternatively, you can create portfolios of your existing holdings by clicking Link to Brokerage, or clicking Add Manually to input the ticker symbols one by one.
Step 4: When you click on the Upload File link, a dialog box should open on your computer, as shown below.
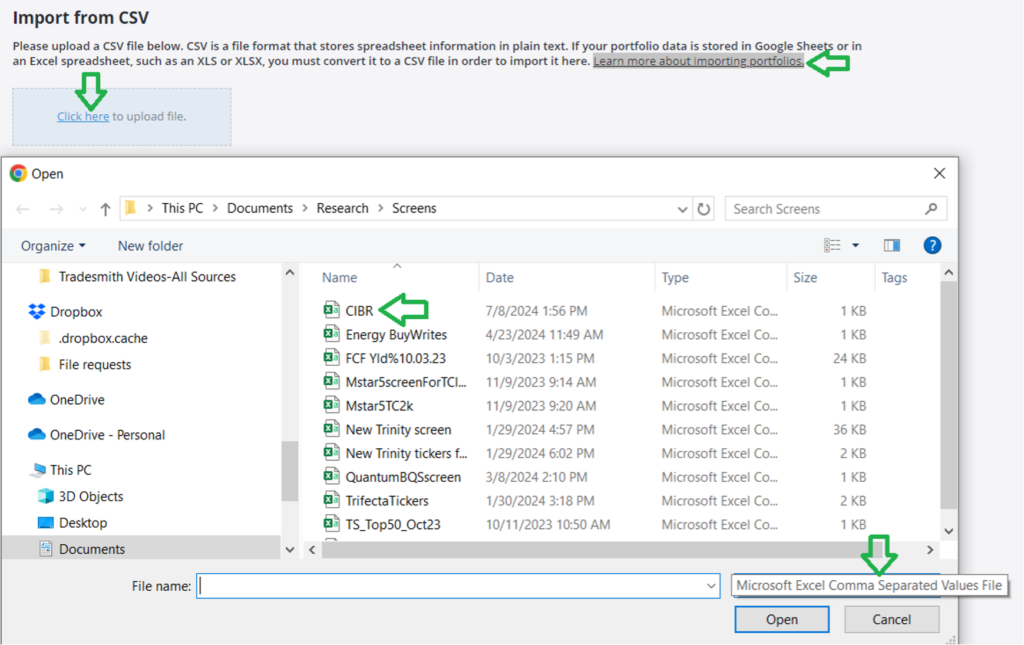
All you need to do is navigate to the CSV file you just saved in Step 2 above, then click on it to open and import the ticker symbols.
The tickers for each stock should appear like magic. From the dropdown box, select the column heading Symbol.
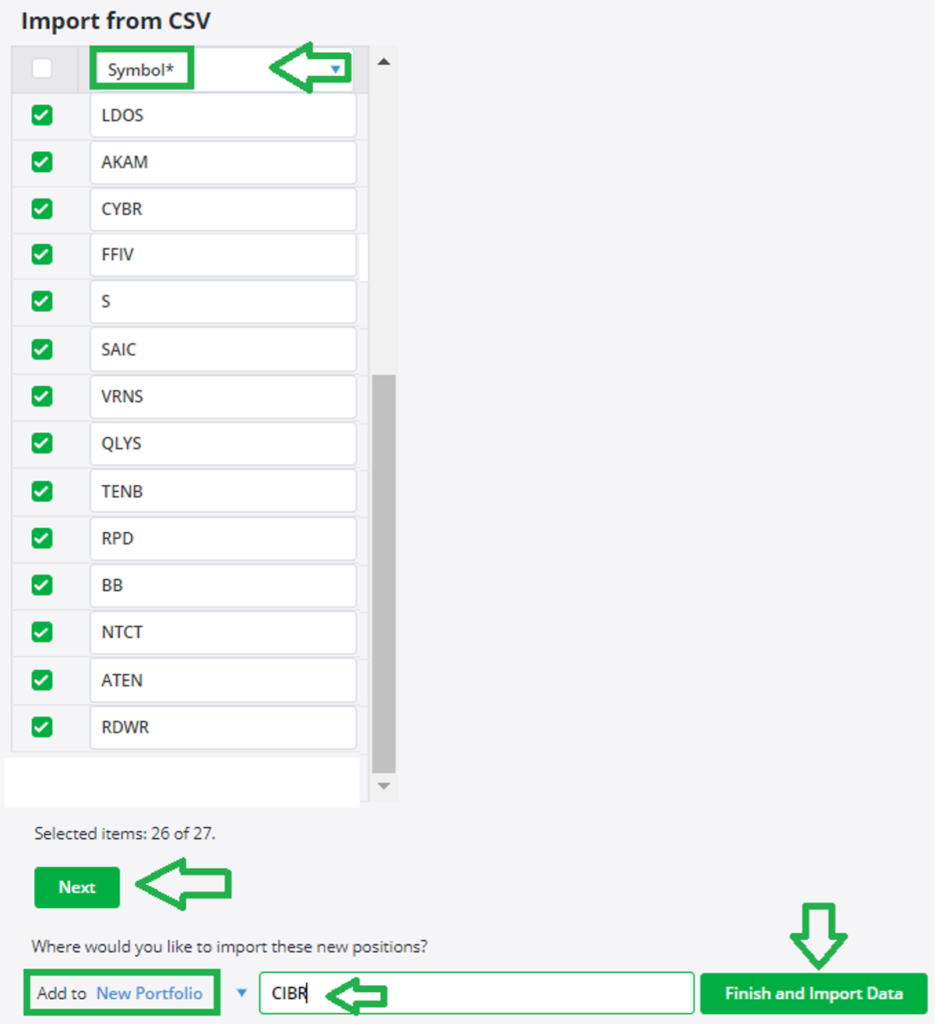
Note: If an error message shows up, it’s typically due to insufficient data or an incorrect ticker symbol. The easiest way to remedy this is to uncheck the box next to the offending data symbol(s) and try importing again.
Step 5: Below the Import list, click on Next and Add to New Portfolio. Enter a portfolio name. I used the ETF ticker, CIBR, lacking imagination perhaps but easy to remember.
Then click the Finish and Import Data button.
Sorting with TradeSmith’s Indicators
Once you successfully import the CSV file, your new portfolio positions will appear in the My Portfolios page. And this is where the real fun begins, using our proven TradeSmith tools and data for more in-depth analysis!
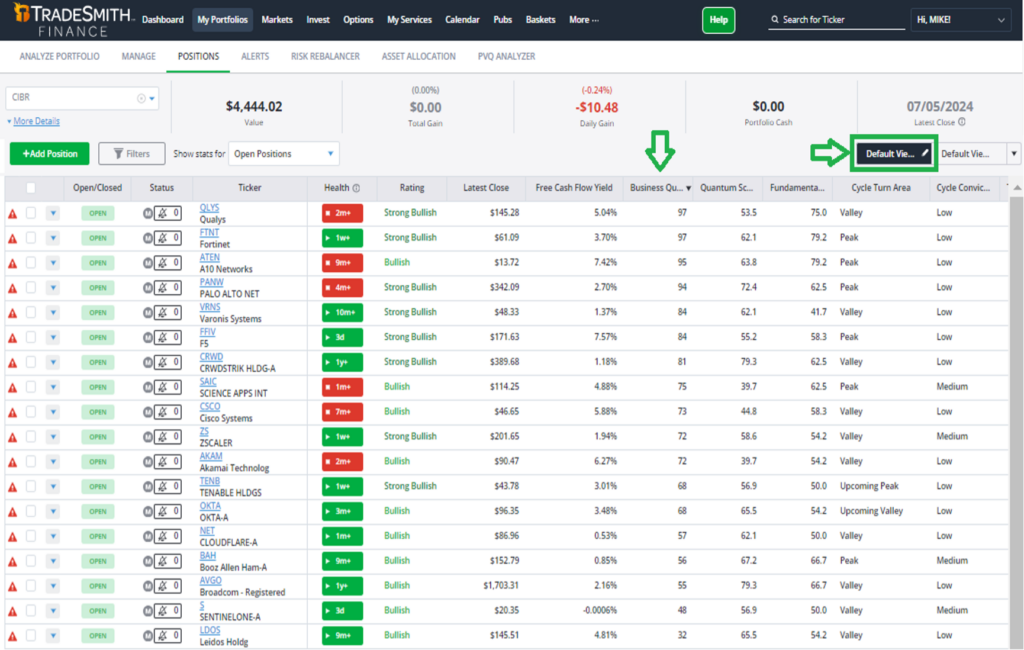
Remember, in My Portfolios, you can easily change the columns displayed by clicking on the pencil icon in the tab labeled Default View at upper right.
This allows you to select any TradeSmith indicators, position details, fundamentals, and more (depending on your subscriptions). If you don’t see the indicators you want in your TradeSmith Finance dashboard — and would like to add more — call 888-623-0858 to discuss.
Once you have the columns you want displayed, you can drag and drop each column to rearrange the order. Just be sure to click on Save to save your changes.
I sorted my CIBR portfolio (shown above in part) by, you guessed it, the Business Quality Score (BQS). One of my favorite TradeSmith indicators, BQS measures a company’s profitability, growth, safety, and payout.
The higher the BQS, the higher the quality of the company – and the stock. That’s why BQS is my personal favorite TradeSmith indicator.
The top 11 stocks all have BQS greater than 70, which is my typical cutoff.
And many stocks at the top of the list also have strong Free Cash Flow (FCF) Yields. For my money, FCF (operating cash flow minus capital expenses) is a much better valuation metric than the more commonly used Price/Earnings ratio. Earnings can easily be manipulated, but FCF is the actual cash income minus costs that a company earns and can reinvest in the business or pay to shareholders as dividends. In other words, free cash flow doesn’t lie.
I’ll note that several of these stocks are in the Red Zone, which you can bypass if you wish. But most stocks also have a Bullish or Strong Bullish rating. And several stocks are in a Valley Cycle Turn Area, meaning there is a higher probability for upside price action.
Here are two that jumped out of the list for me.
- Qualys (QLYS) has one of the highest BQS scores at 97. It’s also rated Strong Bullish and has an attractive 5.04% FCF yield, but it is in the Red Zone. For my money, that wouldn’t eliminate QLYS from consideration, but I’d need to do a lot more homework before pulling the trigger.
- CrowdStrike (CRWD), a bit further down the list, also has a Strong Bullish rating, a BQS score of 81, and is also in a Valley Cycle Turn Area. I also notice it has a Quantum Score of 79.3, which is in the sweet spot of Jason Bodner’s Quantum buy range of 70 to 85.
Mike Burnick’s Bottom Line: Using these five simple steps, you can take a deeper dive into the individual stocks in any ETF we track. Typically, you’ll find that just a handful of outstanding stocks drive an ETF’s performance. And it just got a whole lot easier to find them using TradeSmith’s data analysis.
Good investing,

Mike Burnick
Senior Analyst, TradeSmith