

“Membership has its privileges” is the longtime slogan of the American Express card. And I’m dating myself here, but many years ago, even before I got a Platinum card of my own, the American Express jingle delivered by actor Karl Malden was “Don’t leave home without it.”
These slogans were widely used in TV commercials and print ads that featured expensive items and exotic destinations, implying that certain things were only available to those folks who qualified for the status-symbol credit card and were then eligible for exclusive perks and rewards.
And the same is true for our TradeSmith Platinum Membership. I’ve written previously about TradeSmith Platinum, but our development team has added even more perks and rewards – tools and newsletters – in the last few years.
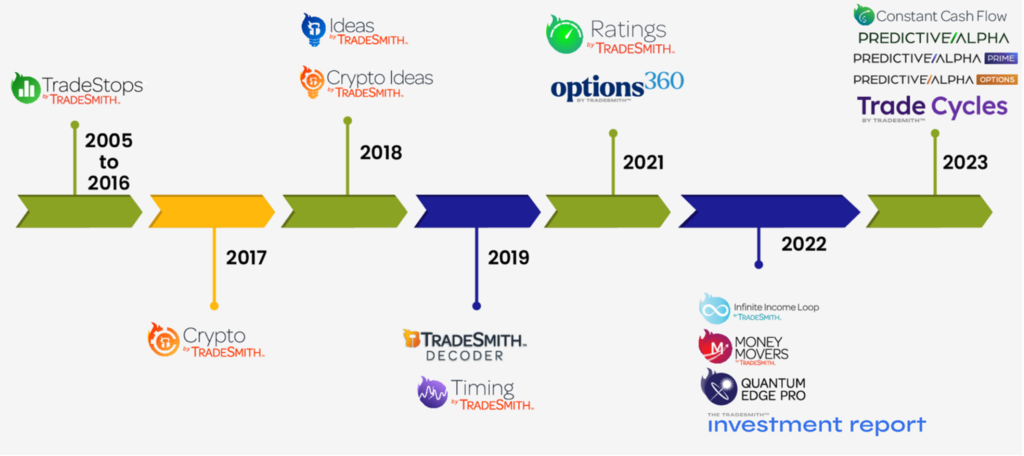
Perhaps the most useful are the TradeSmith Analytics page and the new weekly TradeSmith Platinum Roundup publication. Both features are reserved for Platinum members.
If you’re a Platinum member but haven’t taken full advantage of the TradeSmith Analytics page yet, I’ll give you a brief review of this valuable resource. And if you’re not yet a TradeSmith Platinum Member — and would like to be — use this link to learn more or just call us at 888-623-0858 to discuss. Platinum membership has its privileges.
Platinum-Exclusive Analytics
To access the TradeSmith Analytics tool, simply log in to TradeSmith Finance and, from the main Dashboard page, click on Explore TradeSmith Analytics.
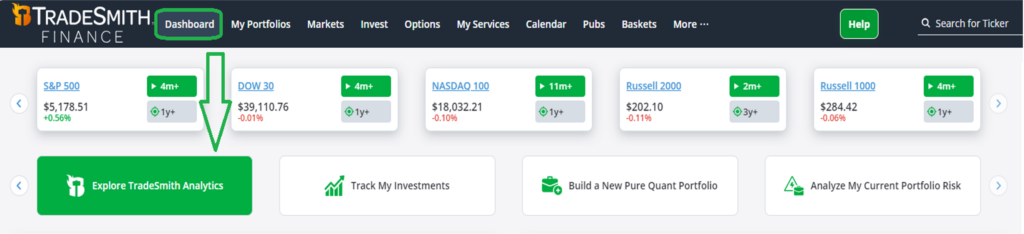
That opens the Analytics main page in a new web tab. In the left margin, you’ll find a menu separated into six sections, as shown below. There is so much intriguing data on these pages that it may seem overwhelming at first.
So, let’s briefly take a closer look at each section, and I’ll point you to my favorites that I use all the time.
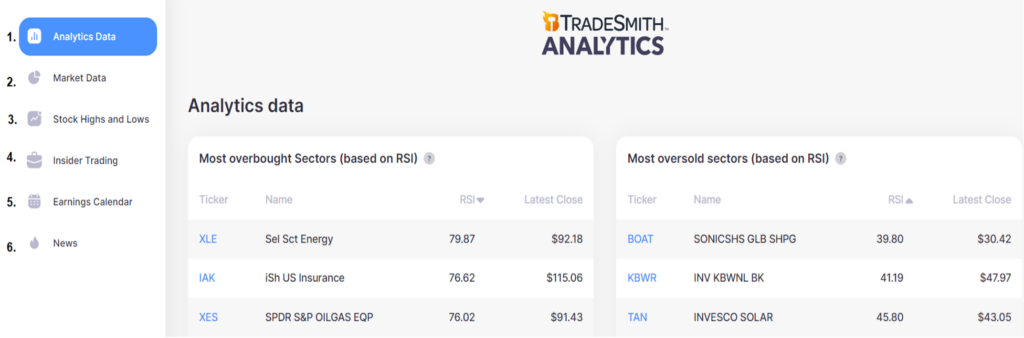
The first item you’ll find is Analytics Data, which includes powerful insights into new investment ideas. These include:
- Most Overbought and Most Oversold sectors based on Relative Strength Index (RSI): RSI is a key measure of any asset’s price momentum. It tells you if any sectors are overbought (with an RSI reading above 70) or oversold (RSI reading below 30). You can click on any ticker symbol, and it will give you more details.
- Business Quality Score (BQS): One of my favorite TradeSmith indicators, BQS measures a stock’s profitability, growth, safety, and payout. The higher the BQS, the higher the quality of the business – and the stock.
- Trinity Stocks: These represent high-quality companies with stocks that trade at a reasonable price and are in a confirmed uptrend. Quality, value, uptrend: three aces to look for in a great investment.
- Free Cash Flow Yield: Studies from firms like S&P Global have shown that Free Cash Flow Yield (FCF) is one of the best predictors of “alpha,” or how much a stock outperforms the market.
FCF is also an excellent valuation metric. For my money, it’s much better than the more commonly used Price/Earnings ratio. That’s because, while earnings can easily be manipulated, FCF (operating cash flow minus capital expenses) is the actual cash income minus costs that a company earns and can reinvest in the business or pay to shareholders as dividends. In other words, free cash flow doesn’t lie. - Performance Leaders: Click on the dropdown menu and sort the list by one-month, six-month, 52-week, or year-to-date performance (shown below). This is a valuable indicator of momentum in the stock market that tells you which stocks and sectors are leading the way.
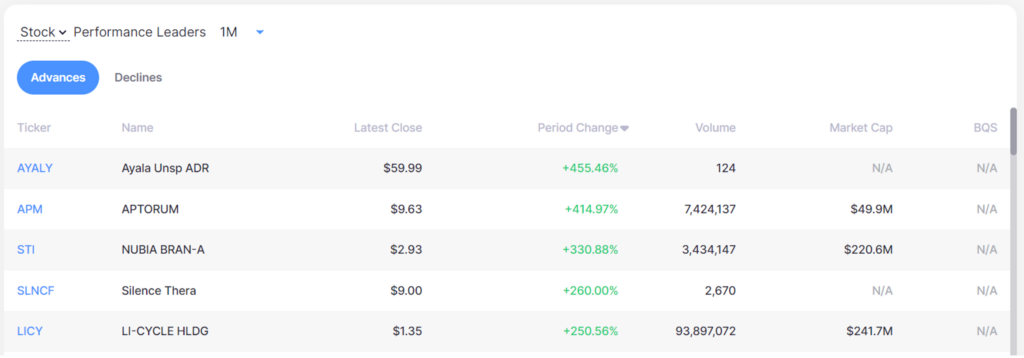
I personally use this data on a regular basis to spot shifts in stock-market leadership. In my book, the best combination is to find out-of-favor stocks, with low or even negative change on a 52-week basis, that have recently moved to the top of the one-month-period list.
More Menu Items
Briefly, the other Analytics sections are:
Market Data: Here you’ll find a colorful mosaic of S&P 500 performance by stock and sector. The heat map format helps you identify what’s hot and what’s not from a list of U.S. and global market indexes, plus commodities and currencies. On the Market Data page you’ll also find:
- Market Fear & Greed barometer: This TradeSmith indicator tells you at a glance if investor sentiment is too bullish (greedy) or too bearish (fearful) so you can better time your investment allocation.
- S&P Sector Performance and Industry Performance data: Here you can toggle between one-month, six-month, 52-week, or year-to-date performance. This is a great indicator to see at a glance which sectors and industries have the strongest price momentum – and which are lagging.
Stock Highs and Lows: In this section, you’ll find an expanded list of stocks making new highs or new lows. The default is 52 weeks, but once again, you can sort this list by one-month, six-month, 52-week, or year-to-date performance. This handy tool zeros in on the individual stocks that are leading or lagging the market over different time frames.
Insider Trading: Here you’ll find a comprehensive list of insider stock trades based on the most recent Form 4 filings that insiders are required to submit to the SEC. The data includes the number of shares bought or sold and at what price.
Earnings Calendar: This is another invaluable feature of TradeSmith Analytics that I use every earnings reporting season, four times a year, to keep track of upcoming earnings announcements from stocks I own or would like to own.
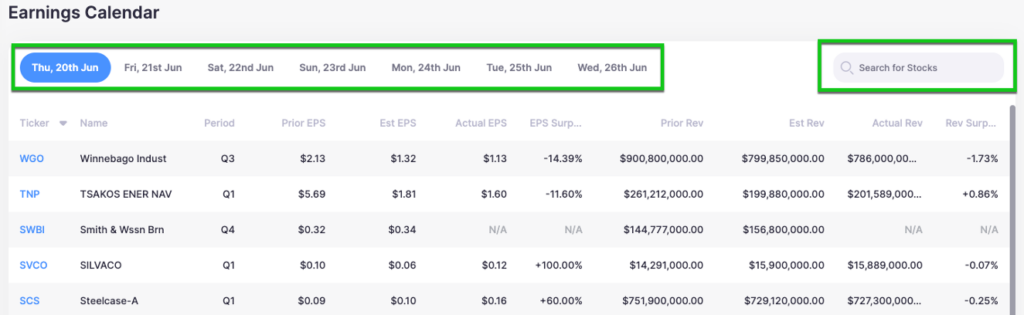
It lists earnings for the next week, grouped by day. And if you’re not sure when a specific stock is due to release results, use the Search for Stocks feature to find the exact day of the week the stock reports. The table includes EPS and Revenue data for the Prior period’s reported results compared to analyst estimates (Est) and the Actual numbers. So, you can quickly see if it was a positive or negative surprise.
News: We’ve collected and posted news you can use from a wide variety of sources: the Associated Press (AP), Business Insider, CNBC, our corporate partner InvestorPlace, The Wall Street Journal, and many more. Plus, you can filter by source in the settings menu to select only those sources you prefer.
TradeSmith Platinum Roundup
A Platinum Membership privilege recently launched is the weekly Platinum Roundup publication we email to Platinum members every Saturday.
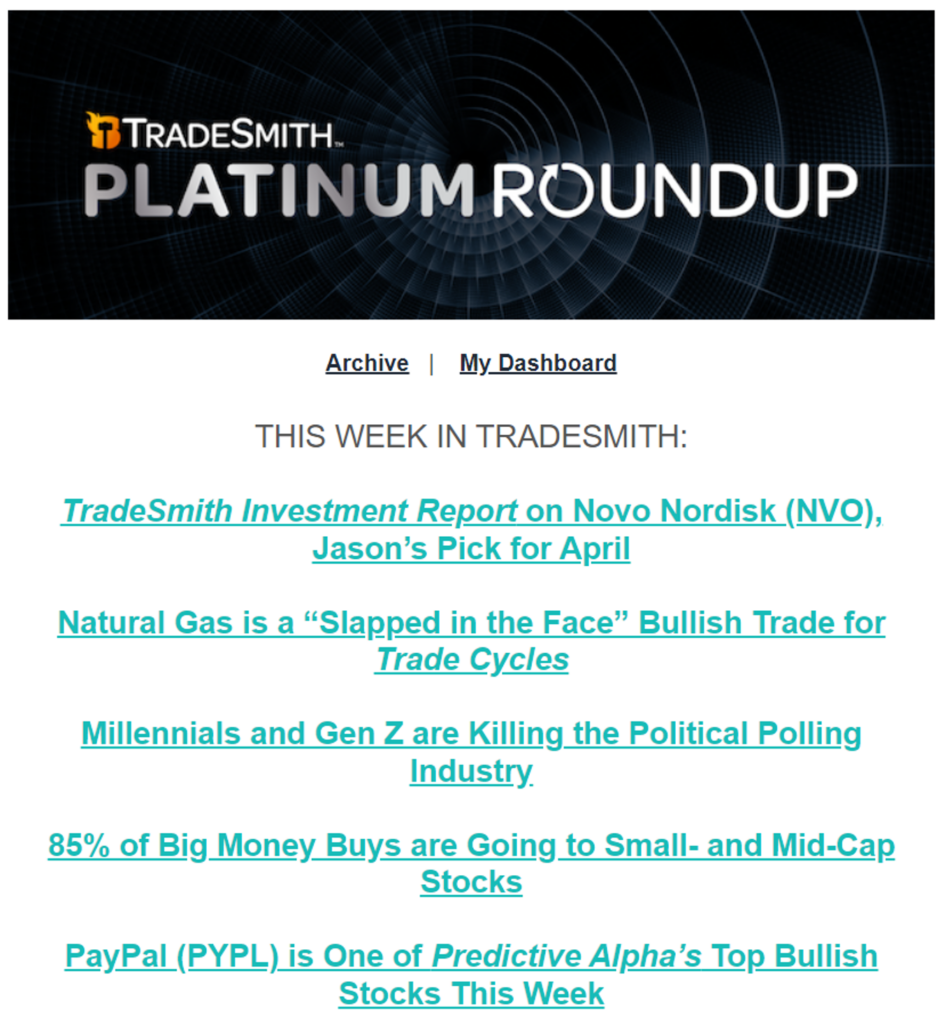
With a TradeSmith Platinum membership, you get access to EVERYTHING we publish here at TradeSmith. And I do mean everything! You have full access to all tools and newsletters, which today is a wealth of AI-powered analytical data and publications including:
- All our proprietary risk- and portfolio-management tools for every asset class we track.
- All the market health tools, screeners, and strategies, plus Platinum-only portfolios and baskets.
- All the market-forecasting tools of Trade Cycles by TradeSmith, including Cycles and Seasonality.
- All the detailed recommendations and curated portfolio positions from 10 TradeSmith newsletter services.
- All the money-making Options360 options-trading and analysis tools, which use AI to find option trades with the highest probability of success. This includes the income-producing Constant Cash Flow and Infinite Income Loop trade alerts, plus follow-up analysis from yours truly.
You can even pass your membership on to any heir you choose, so your family can benefit for many years to come.
Having access to the full suite of TradeSmith products is a huge advantage. Each of our products and services is powerful on its own, but they’re even more effective when used together.
However, your email inbox can easily get overloaded with our valuable trading insights and analysis. And you could easily miss potential money-making trades. That’s where Platinum Roundup becomes invaluable.
Each week you get a full and detailed review of every trade entry and exit for every one of our publications. This includes links to every issue we publish so you can easily catch up on any trades or analysis you may have missed during the busy work week.
Heck, even I get so busy that sometimes I’m not aware of all the trades my colleagues placed during the week. But every weekend I can grab a cup of coffee, relax, and use the Platinum Roundup to catch up on everything that’s happened in TradeSmith.
Our editor-in-chief also asked me to give my bottom line on the markets, so you’ll see that in each Platinum Roundup as well. Sometimes it inspires me to create new screeners to go along with it, like one I recently added to find you stocks that should survive and thrive in the stagflation economy. Those are a Platinum exclusive, too.
Mike Burnick’s Bottom Line: Our new TradeSmith Analytics page and TradeSmith Platinum Roundup email are powerful additions to our lineup. They make it much easier to access the total value of your Platinum membership. And as a TradeSmith Platinum member, you get full access to every software tool and advisory service we offer, now and in the future, for as long as you or a family member continue on as a subscriber. Combined with the other benefits I mentioned, Platinum membership is one of the best investments you can make in your financial future. After all, membership has its privileges!
Good investing,

Mike Burnick
Senior Analyst, TradeSmith