Use These Two Simple Strategies to Find Oversold Stocks with Strong Rebound Potential
Some folks consider themselves staunch long-term investors, like Warren Buffett – whose favorite holding period is “forever.”
At the other end of the investment spectrum are your day traders: This group likes to place their bets during the trading day but are often out of those same trades by the end of the day, win or lose.
And then there are the traders – with dozens of different technical trading strategies – that fall somewhere in between the two.
You could call some of these in-the-middle strategies “swing trading,” as following the strategies could involve staying in a trade for anywhere from several days to a few weeks. And though the groups at either end of the spectrum might scoff at the idea, swing trading can be incredibly profitable… as long as you’re using the right strategy.
And TradeSmith’s suite of analytics and portfolio-scanning tools provides you with access to several powerful swing trading strategies, with new actionable trade ideas available every day: This includes our proprietary Snapback Strategy, as well as our Platinum-exclusive Bollinger Band Strategy.
Based on your feedback and the emailed questions we’ve received, it’s clear that many of you want Inside TradeSmith to cover these two popular swing trading strategies in more detail.
And with markets still volatile in the wake of tariff uncertainty, there’s never been a better time to take a closer look at swing trading and learn how you can apply these strategies yourself.
Make the Most of Volatility with the Snapback Strategy
First, let’s cover the TradeSmith Snapback Strategy. This is a feature of Ideas by TradeSmith, and is available to members with Ideas, Trade360, TradeSmith Essentials, and TradeSmith Platinum subscriptions.
The Snapback Strategy was designed specifically to capitalize on volatile market conditions – just like the ones we’ve seen in recent weeks.
We use short-term moving average divergences, along with historical price comparisons, to help us pinpoint oversold stocks that are likely to produce a quick, sharp rebound in price.
We backtested this simple strategy on the S&P 500 going back 10 years. And the average return, counting both wins and losses, was about 16%!
The strategy works whether stocks are rising in a bull market, but shines when stocks are in the midst of a bear market… because it targets those time frames when certain stocks reach oversold extremes.
This rules-based trading approach gives you a tactical edge, especially in volatile markets – by buying into the downside dips and profiting from the upside rips.
It makes for a great swing-trading strategy to scale into. And the easiest way to access our Snapback Strategy signals from your TradeSmith Finance dashboard is to click on Invest, then select Opportunities from the page menu.
Next, from the dropdown menu labeled Strategies, select Ideas Lab, then scroll down to Snapback and check it.

You’ll see up to the top 20 results that qualify for our Snapback Strategy. When I ran this search yesterday there were only five results, shown below:
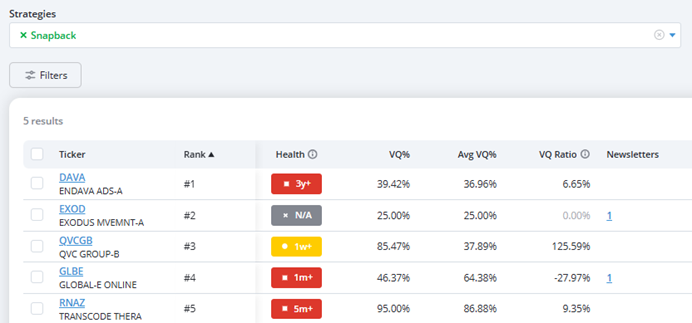
Notice that most of these stocks are in the Health Indicator Red Zone. Don’t fret: The Snapback Strategy is designed for shorter-term trading, while the Health Status indicator is a longer-term indicator that’s irrelevant to this trading approach.
To summarize how the Snapback Strategyworks:
- Our system scans for oversold stocks, as measured by various moving averages along with past price patterns. With this strategy, we aim for quick profits on an expected price reversal.
- These stocks selected by our system are set up for a quick rebound after flashing an entry signal – at which point we can enter a bullish position.
- The exit signal for each position flashes once a stock has moved back above its key moving average again – OR after 21 trading days – by which point the target should have “snapped back” to its longer-term trend, enabling us to profit from the recovery.
Traders aiming to capitalize on temporary stock pullbacks can consider using the Snapback Strategy. Just remember that this is a short-term approach: You’ll want to make sure you’re prepared to take action on positions as soon as signals flash (and you may want to make sure you’re getting alerts from TradeSmith Finance as trades develop).
A Platinum-Level Strategy using Bollinger Bands
As an exclusive feature for our Platinum-tier members, TradeSmith recently introduced the Bollinger Band Strategy, which aims to profit from oversold stocks similarly to the Snapback Strategy, but it uses an entirely different set of indicators.
Bollinger Bands are a popular technical indicator, developed by the trader John Bollinger. His bands consist of three lines:
- The Middle Line, which is the stock’s moving average (MA)…
- The Upper Band, which is two standard deviations above the MA…
- And the Lower Band, which is two standard deviations below the MA.
The Bollinger Bands create a “channel” around a stock’s moving average, as you can see below. The Middle Line is represented by a dotted green line, while the Upper and Lower Bands are in light blue:
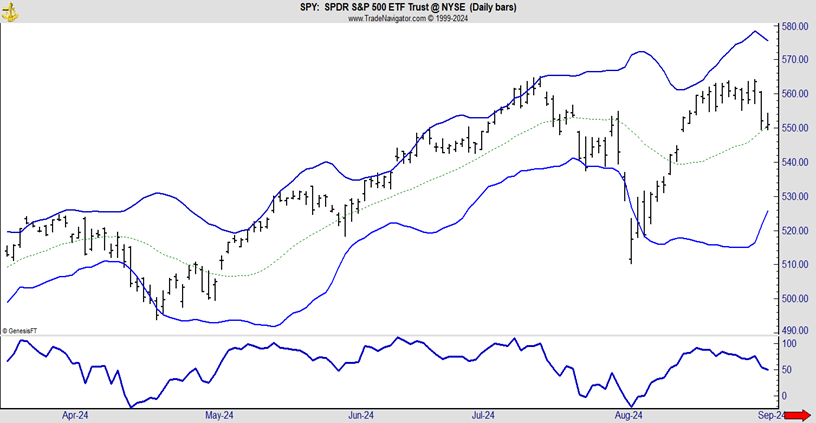
At a glance, this channel tells you how far prices usually move up or down.
By default, it’s a 20-day MA with bands two standard deviations above and below the MA – and those are the settings our strategy is based on.
To get a little more technical, the line in the bottom pane (the dark blue line beneath the Lower Band) is the %B value. This indicator tells you where the stock’s current price is within the Bollinger Band channel… and it’s a value that’s the key to our trading strategy.
- If the %B value is 100, the price is at the top of its channel – and the stock is likely overbought.
- If %B is 0, the price is at the bottom of its channel – and the stock is likely oversold.
- If %B is 50, the price is halfway between the upper and lower bands, at or near the moving average.
So, with the %B indicator, there’s no need to guess whether a stock’s price is oversold or overbought. This indicator shows you exactly where price is within its recent channel (or range). And similarly to the Snapback Strategy, we’re looking for stocks to return to or near the mean after going oversold – making this exact indicator all the more valuable.
It’s like a pendulum that swings too far in one direction and is then poised to swing back in the opposite direction just after. You can see these swings on a Bollinger Bands chart when the %B indictor moves from high to low and back.
OurTradeSmith Bollinger Bands Strategy looks for %B to be oversold for stocks priced over $10 per share. Then…
- If the %B value is below 20 for three consecutive days, it triggers a buy signal for the strategy.
- We exit the trade after 21 trading days – OR once the %B value moves back to 50 (neutral), which means the stock traveled back to its 20-day MA.
Of course, like any indicator, it won’t be right 100% of the time. But in our backtesting, we found that:
- 74.1% of all trades made with the Bollinger Bands signals were closed with a gain…
- The average gain of a Bollinger Bands trade was 1.73%…
- And 78.2% of the strategy winners outperformed the S&P 500.
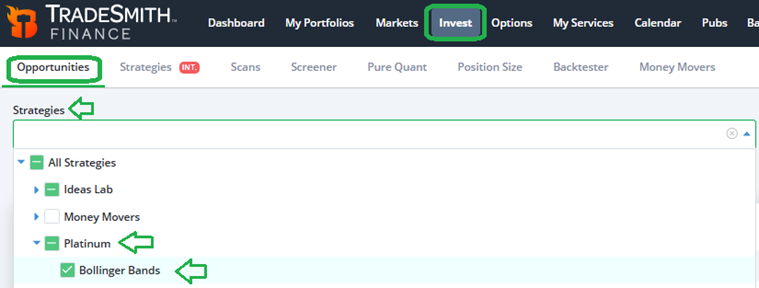
To access the Bollinger Bands Strategy simply navigate to Invest on your TradeSmith Finance dashboard, then select Opportunities from the page menu – just like we did to access the Snapback Strategy.
Next, from the dropdown menu labeled Strategies, select Platinum, then scroll down to Bollinger Bands and check it:
Remember, to access this strategy you must be a TradeSmith Platinum member. So, if you don’t see the Bollinger Bands strategy on your platform, but would like to, give us a call at 866-220-1107.
When I ran a search for Bollinger Band trades yesterday, there were 150 results that made the list of strategy candidates. The top 10 results in rank order are shown below:

What can I say? Plenty of oversold stocks around after the S&P 500 lost ground last week.
To summarize the Bollinger Band Strategy:
- To make the most of this short-term strategy, we use the Bollinger Bands %B indicator to scan for oversold stocks that could be set up for a quick rebound.
- Entry signals occur for stocks > $10 when the %B value is below 20 for three consecutive days – at which point we open a long position.
- The exit signal for a Bollinger Bands trade flashes when %B moves back above 50 (back to neutral)– OR after 21 trading days – by which point we can capitalize on the reversion to mean. And with the %B value, we can determine exit signals far more precisely.
Traders aiming to profit from oversold opportunities in stocks with strong recovery potential should consider using this strategy. It can also be useful for determining entries into longer-term holds, with a bit of creativity.
Members can also access both the Snapback and Bollinger Bands strategies, if subscribed, using our TradeSmith Screener.
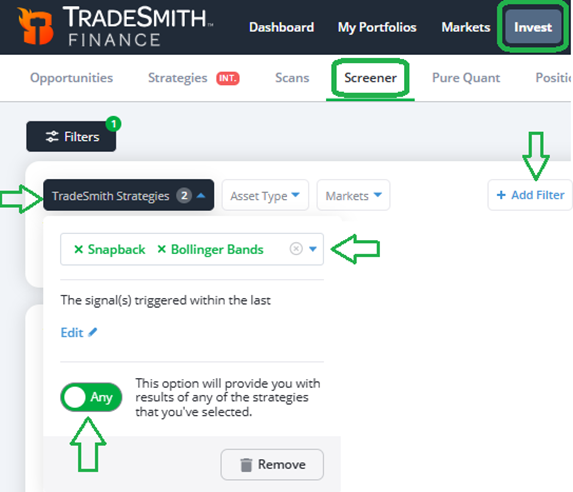
To run a screener based on these strategies, simply navigate to Invest from your TradeSmith Finance dashboard, then select Screener. On the following menu, click the + Add Filter button to customize your search.
From the TradeSmith Strategies category, use the dropdown menu to find Ideas Lab, then click on Snapback Strategy.
Next, still under TradeSmith Strategies, you can scroll down to Platinum and click on Bollinger Bands. With these two boxes checked, you can screen for stocks that qualify for both strategies at the same time.
Note: in the TradeSmith Strategies selection dropdown, toggle the settings slider to ANY to get results for either strategy. Or toggle to ALL to get only results that qualify for both strategies at the same time.
Often there is some overlap between the Snapback and Bollinger Bands strategies, because both aim to uncover oversold stocks with strong reversal potential. So, it gives me even more confidence in a potential trade when I find stocks that qualify for both strategies at once.
But when I ran it yesterday, only one stock – Endava ADS (DAVA) – made the cut for both.
Bottom Line: The Snapback Strategy and the Bollinger Bands strategy are both tailor-made for volatile markets when stocks are prone to oversold extremes, then bounce back again. I check both strategies on a regular basis to come up with new short-term trade ideas.
Plus, I frequently run the screener for both strategies combined for even higher conviction trade ideas, that qualify for both strategies at the same time.
Good investing,
Mike Burnick
Senior Analyst, TradeSmith
P.S. TradeSmith’s Snapback and Bollinger Bands strategies are powerful – and can deliver great results when stocks drop and recover over the short term.
But when it comes to managing your portfolio (and your wealth), you can’t just look at the market three weeks at a time: To unlock those truly breathtaking results, it’s critical to think about the long-term, too.
And that’s exactly what legendary investor Louis Navellier, my colleague over at our corporate partner InvestorPlace, aims to do with his latest trading system.
Using his proprietary Stock Grader system, honed over 47 years, Louis has uncovered 175 stocks that have soared 1,000% or more. In just the first few months of 2024, this same system helped deliver gains of $5,500 on Axcelis, $14,000 on YPF, and even $45,360 on Vista Energy – all without options or high-risk strategies.
Now, he says the biggest opportunity of the decade is already unfolding.
Louis calls it Liberation Day 2.0 – and he believes it could trigger a $10 trillion investment wave.
His system is already flagging three new stocks he believes could double or even triple in the coming months.
And TOMORROW, Wednesday, May 28 at 1 p.m. Eastern, Louis is hosting a free live event where he’ll reveal his full strategy – including the names and tickers of his top-rated stock picks.