Watch These Sectors for High Performance as the Fed Cuts Interest Rates
With Election Day now in the rear-view, investors can turn their attention back to more enjoyable pursuits – namely, searching out the best investment opportunities on the market today.
And the stock market has one big, positive factor going for it right now: favorable seasonality.
In fact, stocks just entered the six-month sweet spot for market returns. As the chart below shows, the period from November through April has been the best six-month period to own stocks for the last 75 years, with the S&P 500 posting average gains of 7.2% across the period:
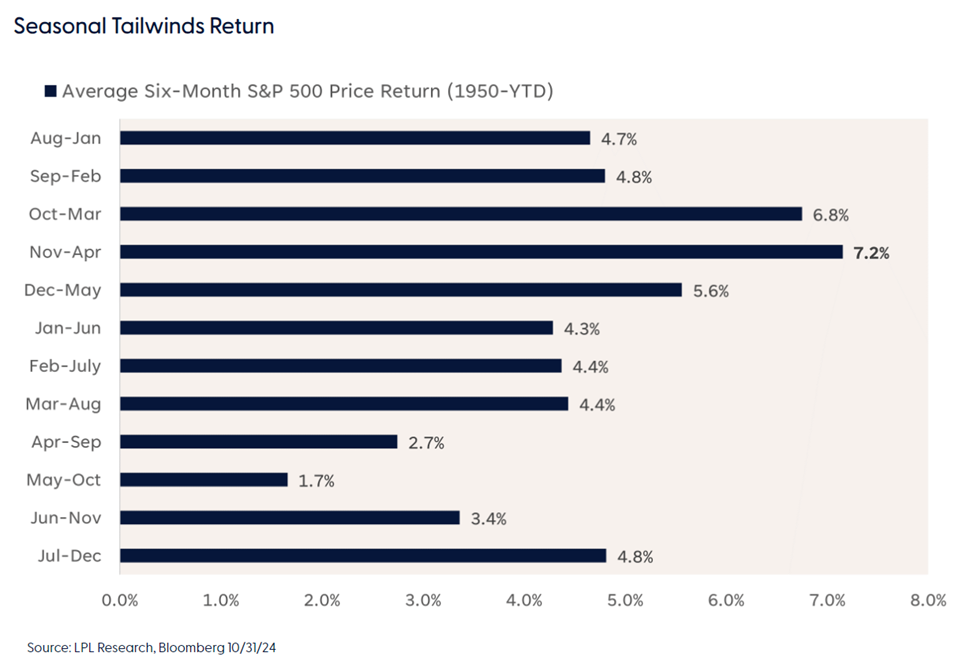
Investors should very much look forward to the next few months, especially when compared to the other six months of the year – a period that, as shown above, has historically underperformed. The span from May through October often sees the S&P 500 Index post only a small average gain of 1.7%.
Here’s a fun bit of investing trivia for you: If you had invested $100 only during the November to April period from 1945 until today, it would have grown to approximately $12,500. But $100 invested in the market only through the May to October stretch would have grown to just $275 across the same period.
That said, don’t take that as a sign to liquidate your portfolio come spring: I’m not suggesting you should consider investing this way – going long on Oct. 31 and cashing out on May 30 each year. After all, every “rule” of investing has its exceptions, and there have been plenty of years where the S&P 500 booked double-digit gains during the so-called “worst” six months of the year. That’s happened two out of the last five years, for example.
But it is interesting to consider – and it’s good to be aware of this strong seasonal tendency for stock performance from now through next April.
But strong seasonality isn’t the only thing the market has going for it right now; there’s another force working in favor of stocks – and that’s the Federal Reserve’s plan to keep lowering interest rates.
While the final pace and magnitude of future rate cuts is an unknown, when the Fed starts a monetary easing cycle, they typically follow through with a series of rate cuts. With two cuts already in the books for this cycle, we’re likely to see interest rates fall further still over the next year.
But the real question is, with these two tail winds pushing the stock market forward, which stocks and sectors can benefit the most? Based on historical performance, the likely answer lies in this chart:
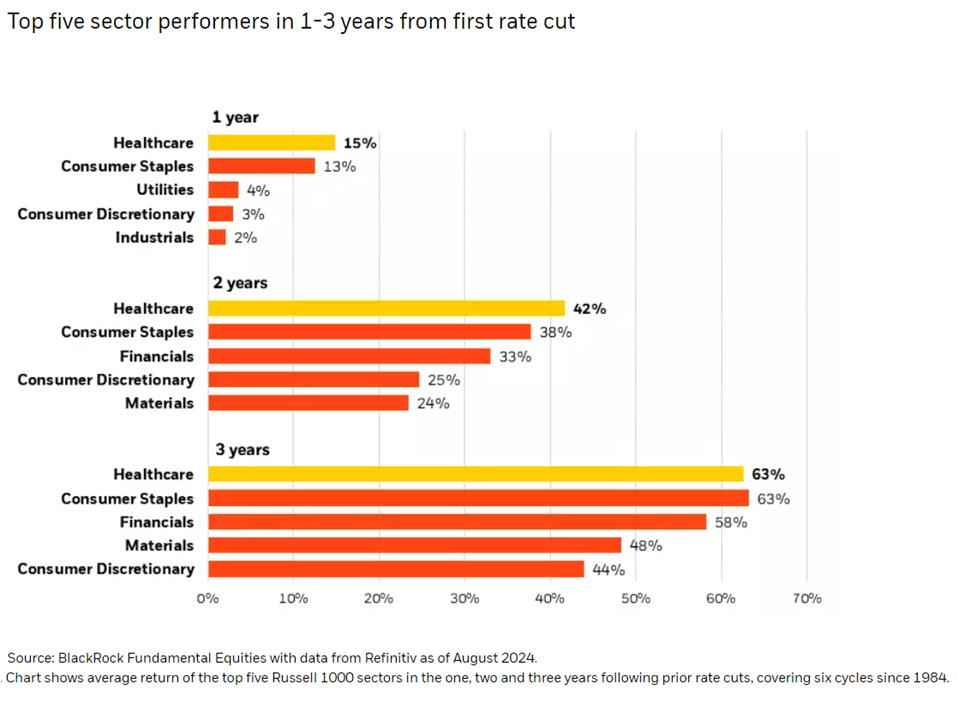
As you can see, in the three years after the Fed’s first interest rate cut in a given easing cycle, both Healthcare and Consumer Staples are the top-performing sectors of the S&P 500 Index.
And while these two sectors thrive above all others in the first year following rate cuts, over the two- and three-year periods after the Fed starts cutting rates, Financial and Consumer Discretionary stocks also join the index outperformance party – though they still lag behind the top-performing sectors.
But that’s not all; election year seasonality can also play a role in forecasting future sector performance. And many of these same sectors are set to shine post-election. Since 1944, in just the first six-months following an election year…
- Financials gain a cumulative 486.1% and are up 80% of the time…
- Healthcare is up 385.4% a full 70% of the time…
- And Staples gain 286.2% and are also up 80% of the time.
With that in mind, let’s create a simple TradeSmith Screener to explore this potential opportunity. We’ll focus on healthy, high-quality stocks in an uptrend, that are in the Healthcare, Consumer Staples, Financial, and Consumer Discretionary sectors.
Here’s how I’ve set up our search:
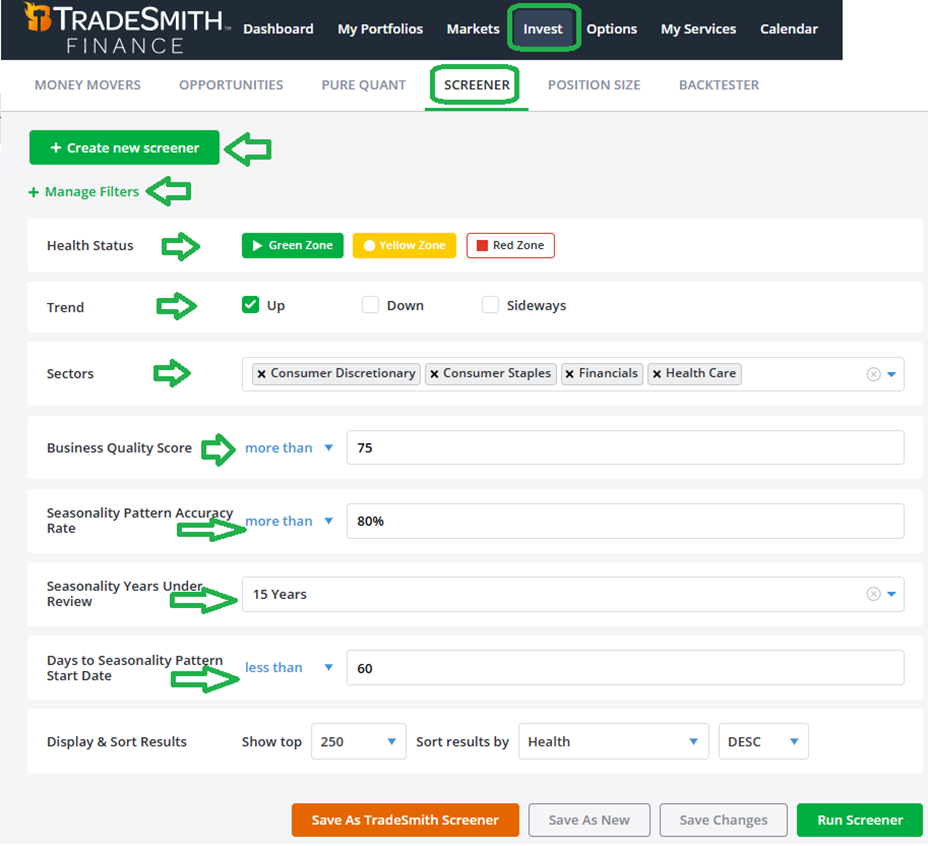
To build this screener for yourself, log in to your TradeSmith Finance dashboard, click on Invest at the top of the screen, followed by Screener, and then select the green + Create new screener button.
You can add filters by clicking + Manage Filters, then selecting options from the list. We’re looking for healthy, high-quality stocks in an uptrend, so we’ll want to search for stocks with a Green or Yellow Health Status – and limit our search to stocks with a Business Quality Score (BQS) over 75. Be sure to only check the “Up” option when selecting Trend – and don’t forget to select your chosen sectors.
In addition, to help improve your trade timing, let’s limit the results further – and look only at stocks with accurate, bullish seasonality windows coming up in the next three months. We can do this by selecting some of our Seasonality filters. We want these patterns to come soon, so we’ll set our Days to Seasonality Pattern Start Date to less than 60.
Next, I set the bar high with a Seasonality Pattern Accuracy Rate of 80% or more, to have a higher confidence that these patterns should repeat as they have in the past.
And for Seasonality Years Under Review, I set the target to 15 years – so there would be plenty of years’ worth of data in our sample size.
All of these filters can be adjusted as you see fit to get more or less results. Plus, you can also add other TradeSmith or Fundamental filters to narrow your own results even further.
When I ran this screener yesterday, I got 59 results. Here are the top 10, that met all my screening filters:
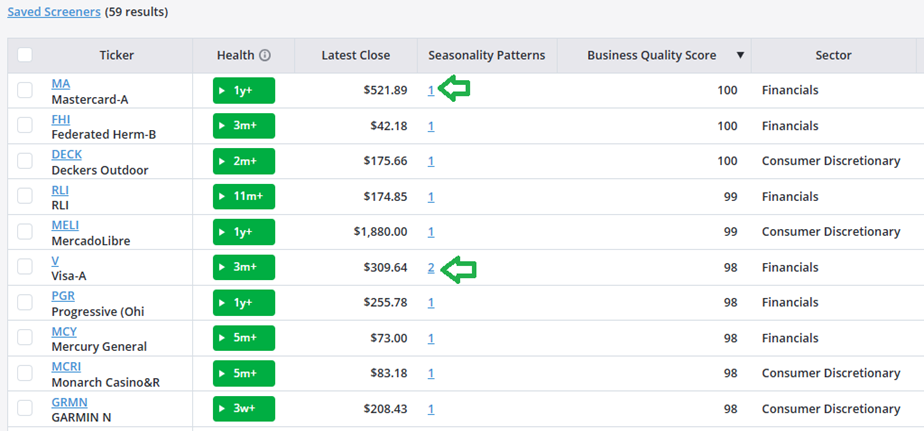
By clicking the number listed under the Seasonality Patterns header, you can view the details of the upcoming bullish stretch – whether that includes a single trend period or more, as is the case for Visa (V) in the list of results above.
Mike Burnick’s Bottom Line: This TradeSmith screener is quick to set up and easy for to duplicate – making it great to save and modify to build your own customized search tool. When you spot one or more sectors that are rotating into a historically bullish period, you can use this saved screener to easily find the highest-quality stocks expected to perform well over the period – with just a few clicks.
While seasonality trends aren’t guaranteed to repeat, examining a stock’s historical trends – and the historically bullish or bearish periods for the market – can deliver potentially profitable buying opportunities for you in 2025 and beyond.
Good investing,
Mike Burnick
Senior Analyst, TradeSmith
P.S. Seasonality trends and historical data can help guide your investments, especially in the long term – but there’s more to the market than its past performance. You can’t ignore what’s happening in front of you right now, even if the data says otherwise.
Few people believe this as much as Jonathan Rose, lead analyst at our corporate partner Masters in Trading. After spending 25 years learning his craft on the Chicago trading floors and inside private investment firms, Jonathan now offers up live trading ideas, market commentary, and trading education each morning. And he’s been working on something special.
Jonathan has been studying the day-to-day movements of the market – and he’s ready to debut a new tool to help his growing community of traders capitalize on short-term opportunities.
Next week, on Tuesday, Nov. 26, Jonathan will be going live to share his findings and teach you all about his new options-trading strategy. You won’t want to miss it – and you might not have a second chance to watch.
Click here to reserve your spot – and get ready to see how the Masters in Trading handle the market.