
When These Three Indicators Converge, Follow Them for Higher Conviction and Potential Profits
Don’t look now, but 2025 is almost halfway over already.
And what a wild ride the past six months have been…
Tariff trauma came to a head in early April and created a bungee-jump style market drop – to near-bear market levels – which was followed by an equally dramatic (and shockingly speedy) recovery back towards all-time highs.
In fact, after all the dust settled, the S&P 500 has changed just 2.05%, thankfully to the upside, since the index closed on New Year’s Eve 2024!
But despite the market being roughly flat for the year now, it sure feels like a heck of a lot more has happened in the markets over the last six months… at least my thinning grey hair is proof of that.
So, what will the second half of 2025 have in store for markets? With economic uncertainty still running unusually high today, it’s anyone’s guess.
But stock market seasonality may offer us a few clues…
Looking Forward to Summertime Seasonality
Reviewing the market’s historical data, the good news – as you can see below – is that June is on track to deliver a nice monthly gain, at least so far. This runs counter to its reputation for sub-par results – indexes have finished June up only 40% of the time over the last 20 years:
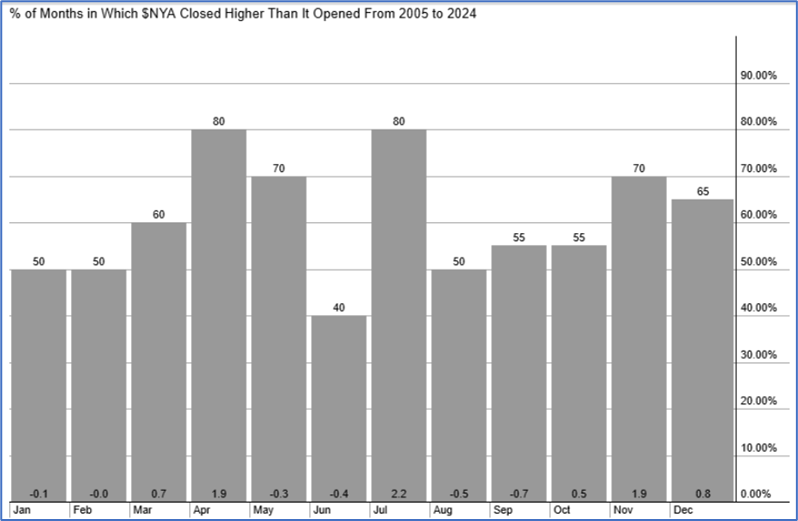
In fact, since 2005 the New York Stock Exchange has consistently posted its worst monthly performances during June – more than in any other month of the year.
And even if June can’t keep it up through the next few weeks, there’s still something to look forward to: next month is one of the best for stock market performance, with the NYSE up 80% of the time in July.
Of course, we all know that these seasonal tendencies don’t always play out exactly as projected from one year to the next. That’s because unexpected events (like tariffs and other major events) can sometimes interrupt the typical repeating patterns.
But it can really pay off to be aware when the hard data alerts us to seasonal buying opportunities, especially when it comes to individual stock signals coming from multiple, independent indicators.
When the stars align and several metrics point in the same direction at the same time, you can place your trades with higher conviction – conviction that can help you secure potential profits!
That’s why now is a good time to revisit TradeSmith’s Harmonic Convergence strategy, which combines several of our popular historical analysis tools into one powerful stock indicator.
We combine our own proven market timing tools – Trade Cycles and Seasonality – with a classic momentum indicator, the Relative Strength Index (RSI), to help you uncover stocks that are likely candidates for bullish or bearish trades.
So, today let’s take a deeper dive into Harmonic Convergence, and discover new stock opportunities coming up soon.
A Winning Strategy of Momentum and Seasonality
For my money, the easiest way to access TradeSmith’s Harmonic Convergence strategies is from the convenient widget we’ve placed right on the main Dashboard page of TradeSmith Finance.
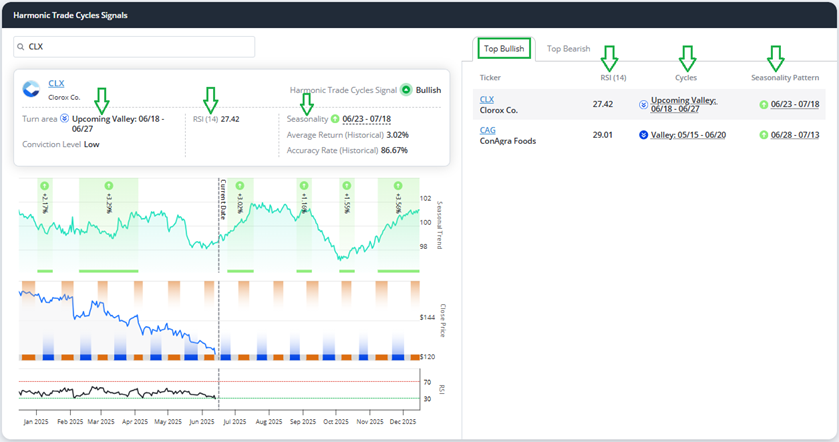
Simply log in to TradeSmith Finance to get started. Then from your Dashboard, simply scroll down the page: Depending on your current subscriptions, you’ll see various widgets arranged for easy access as you scroll through. Thanks to my Platinum-level access, I found the Harmonic Trade Cycles Signals widget we’re looking for just below the Predictive Alpha widget – and right above the Seasonality widget:
The Harmonic Convergence strategy (and the related widget) is available to Trade Cycles, TradeSmith Essentials, and TradeSmith Platinum members only. So, if you don’t see this widget on your platform, but would like to, simply call 888-623-0858 to speak with our Customer Care team and find out more about getting access.
To the left of this Harmonic Convergence widget, you’ll see a featured stock that’s currently displaying a bullish harmonic convergence – in this case Clorox Co. (CLX), as shown above. This stock detail window includes information about the current Cycle turn area, the RSI reading, and the upcoming Seasonality patterns for the featured stock.
And to the right, you’ll find a list of stocks that qualified for both the Top Bullish and Top Bearish Harmonic Convergence lists, which you can select by clicking the tabs at the top right of the widget.
Let’s take a closer look at what it means to appear on each list.
For the Top Bullish Harmonic Trade Signals,our market-scanning tools look for stocks or indexes that meet these three conditions:
- A Composite Cycle Valley turn area, forecasting that the stock is likely to move up in price,
- A high-conviction, positive Seasonality window opening within the next 30 days,
- And an RSI reading below 30 – signaling that the security is oversold and poised to rebound.
In my screenshot above, you’ll notice two Top Bullish opportunities listed to the right of the widget: CLX and Conagra (CAG). Now, simply toggle over to Top Bearish to view stocks primed to fall – as shown by my latest results, below:
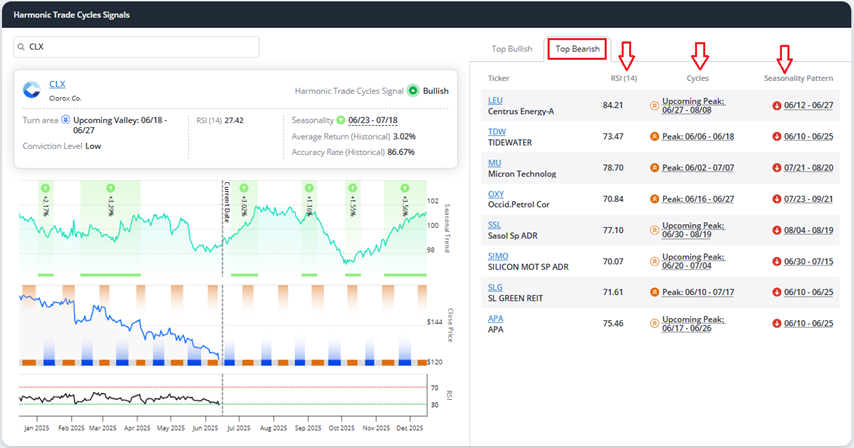
The Top Bearish Harmonic Trade Signals list is full of stocks that meet the opposite conditions to the Top Bullish list:
- A Composite Cycle Peak turn area, projecting that the stock is likely to move down in price,
- A high-conviction negative Seasonality window opening within the next 30 days,
- And an RSI reading above 70, signaling that the security is overbought and ripe for a pullback.
Also, on the left side of the screenshot above, you’ll see that you can type in any ticker into the Harmonic Convergence widget’s search bar: By selecting your ticker of choice, the tool will check for any Harmonic Convergence signals and display the available data for the stock you chose.
You can also access the Bullish and Bearish Harmonic Convergence signals with our TradeSmith Screener tool. To use it, simply navigate to Invest at the top of your TradeSmith Finance Dashboard, then select Screener:
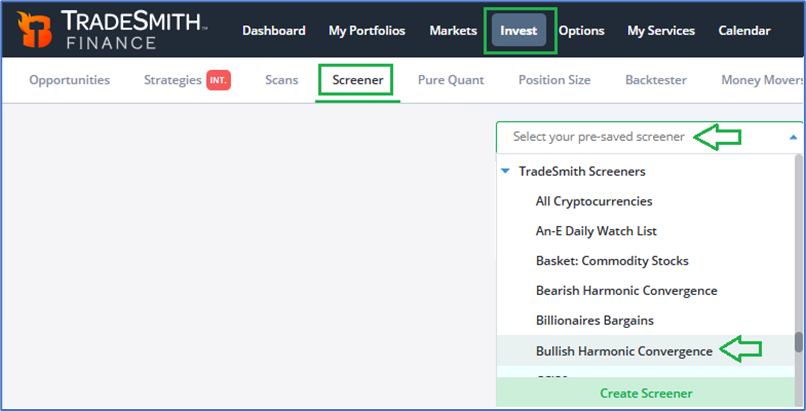
Next, use the dropdown at the upper right labeled Select your pre-saved screener, then scroll down and select Bullish (or –Bearish) Harmonic Convergence to see an expanded list of stocks that qualify for the strategy.
When you load the screener, you’ll see that the base Harmonic Convergence filters are already pre-populated, as shown below. But you aren’t limited to just these filters.
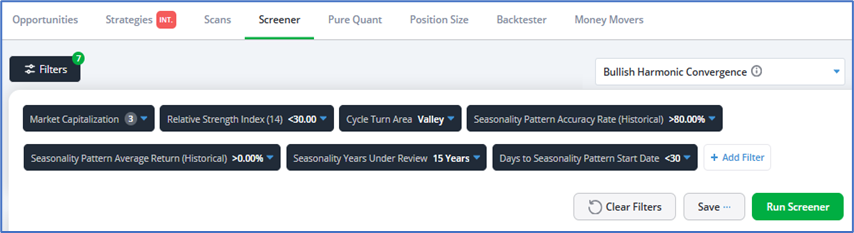
You can add any other screen filters that you see fit. The possibilities are limited only by your imagination.
To do so, simply click on the + Add Filter button. And don’t forget to Save your work for future reference, before clicking the green Run Screener button to see your results.
I got 7 results when I ran this screener on Monday. By clicking on the highlighted numbers in the Seasonality Patterns column shown below, you’ll get details about the upcoming bullish (or bearish) seasonal windows for each stock:

For example, here are the Seasonal details for Champion Home (SKY):
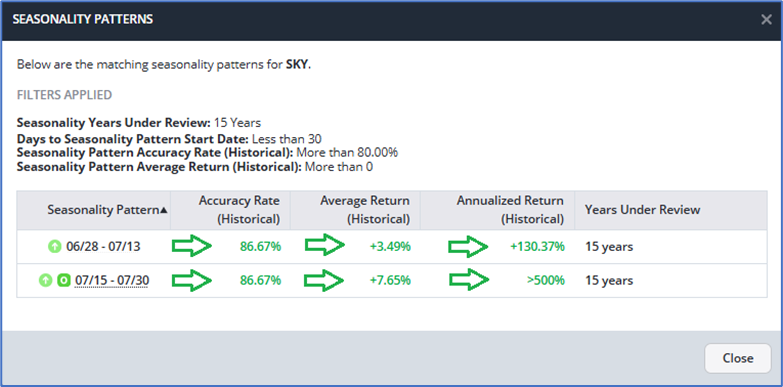
SKY has a bullish seasonal pattern from June 28 to July 13 with an 86.67% historical accuracy rate over the past 15 years, plus an average historical return of 3.49% for the period – which annualizes to +130.37%. Not too shabby!
Even better, another bullish seasonal period starts just a few days later, on July 15, and runs through July 30 – with the same accuracy rate and an even better average historical return of +7.65%. That’s a double-play on seasonality, found with just a few clicks!
Still another way to find stocks that make our Harmonic Convergence lists is by visiting the TradeSmith Baskets page.
From the main menu bar, simply click on Baskets, then scroll down to TradeSmith Baskets and you’ll find both the Bearish and Bullish Harmonic Convergence stock baskets listed near the top – as shown below:

Note that you may find some different results between the Top Bullish and Top Bearish Harmonic Convergence Signals found in the Dashboard widget, your TradeSmith Baskets and the results you get from the Screener.
That’s because the top signals in the Dashboard are just that: the top signals on stocks in a composite cycle Valley period, that also have the most accurate Seasonality patterns historically, and of course feature the right RSI readings on top of that. It’s a more exclusive list – but one well worth watching.
Mike Burnick’s Bottom Line: Our Harmonic Convergence strategy provides you with a quick and easy way to find both bullish and bearish trade setups starting in the coming weeks. And stocks that make this exclusive list deliver a higher conviction of success, because the trade signals are based on the convergence of three different but powerful indicators: our Cycles and Seasonality indicators as well as RSI – all of which are pointing in the same direction.
Good investing,
Mike Burnick
Senior Analyst, TradeSmith
P.S. TradeSmith’s powerful Harmonic Convergence indicators can give you a glimpse into the possible future of a stock – by reviewing decades of historical data and determining whether a ticker is primed to rise or fall at a given time of year, then comparing that data with RSI and our proprietary timing cycles.
But as powerful as this three-piece combo package of timing indicators can be, it can’t tell the future: Unexpected events and external developments can cause a stock to divert from its expected seasonal trends… and when it comes to unexpected events, few things can have as immediate an impact on market prices as quarterly earnings reports.
The tariff trauma that dominated headlines in recent months has settled… just in time for the market to get focused on the Q2 2025 earnings season, which will begin soon – as reports start arriving in early July.
With the market likely to weigh this quarter’s earnings more heavily than usual, there’s plenty of opportunities for trading… but with the season’s high volatility, you’ll need to be careful.
Thankfully, you don’t have to go in blind: The Swan Brothers – two of our latest additions to Team TradeSmith – have cracked the code on this volatile market environment. They’ve developed a stunning system that can scan and leverage millions of social media posts, all to determine the expected result of an earnings report… well before that report hits the newswire. It’s been used to deliver impressive results, including a 900% gain on Kohl’s and a 1,900% profit on Affirm Holdings.
It’s one of the most exciting developments happening at TradeSmith, and the Swans are giving you a chance to benefit from their system this coming earnings season – through Earnings Season Pass.
Click here to learn more about this powerful system – and get an early edge ahead of Q2 earnings.