
Why Smart Traders Are Using This New Tool to Profit in Uncertain Markets
Folks trade stock options for many reasons.
Some speculate on a possible windfall – unlikely as it may be.
But most traders and investors I’ve met use options intelligently as a useful tool to:
- Hedge their stock portfolios to help reduce risk and protect profits…
- Leverage their buying power – it’s far cheaper to buy a call option for $500 than 100 shares of a $50 stock for $5,000…
- And generate recurring income from stocks by selling put options or covered-call options.
This income-generating advantage of options has always appealed to me in a big way.
And now, our TradeSmith software development team just made it easier than ever to uncover trades with high income potential on a daily basis…
Income Now, Discounts Later
For my money, selling put options on quality stocks is the best way to generate consistent income from the stock market.
And today, you have a unique opportunity to do just that – because we’re in a highly uncertain market environment where this strategy works best.
Here’s why: Higher volatility in individual stocks means more option premium income for selling puts. Just understand that when it comes to selling puts you may be on the hook to buy the underlying stock.
So, that’s why it makes sense to sell puts on stocks you’re happy to own anyway. For each put you sell, you get paid cash up front – but you could also have 100 shares of the stock put to you at the option strike price.
For example, let’s say you’d like a shot at owning Nvidia (NVDA) at just $170 per share. With the stock now trading above $185 per share, that’s an 8% discount!
In exchange, you’d get paid the option premium upfront – say, $100 in cash deposited straight into your brokerage account – and you may end up buying the stock at this discounted price.
Now, with that background in mind, let’s talk about market prices and how they often differ from “fair value.”
Market Inefficiency Becomes Opportunity
Textbooks may tell you that markets are supposed to be efficient. But based on nearly 40 years in the business, I can tell you they’re anything but.
The truth is, stocks often trade at discounts or premiums to their true value, and they do so all the time, often by a wide margin.
Take NVDA, for example – currently trading at $187, or about 30 times its sales per share. Is that overpriced?
Perhaps not, if you consider that NVDA sales are growing at more than 70% a year. So, you could argue $187 is a fair price – maybe even cheap.
Like stocks, option prices are based on statistical valuation models. But stock prices can be unpredictable.
And in today’s volatile, high-frequency trading climate, option prices often get out of whack with reality.
That’s where you can find and profit from price inefficiencies – and TradeSmith just launched a great new tool to help you take advantage.
With all of that in mind, I’d like to introduce you to our Options360 Trade Builder tool…
A Smarter Way to Spot Option Trades with Fair Value
To bring this idea to life, we called in TradeSmith’s Chief Quantitative Analyst, Mike Carr.
In this presentation, Mike will show you how the Options360 Trade Builder tool can help traders quickly identify whether options are overvalued or undervalued, combining market price with calculated fair value.

Take the Guesswork Out with Trade Builder
Our Options360 Trade Builder tool helps you quickly identify option trades, no matter if you’re bullish or bearish, short term or long term.
Trade Builder uses our proprietary algorithms and our proven Fair Value tool to help you find options that may be statistically too cheap… or too expensive.
That means you can buy call options that appear undervalued at a relative bargain price – or you can sell put options that appear overvalued to earn a little extra premium income for yourself.
To access Trade Builder, simply login to your TradeSmith account and select on Options in the top main menu bar, then click on Trade Builder from the sub menu on the far right.

Please Note: This tool is available only to TradeSmith Options360 or Platinum members. To learn how to get full access, simply call us at 888-623-0858.
Let’s take a closer look at Trade Builder using NVDA as an example:
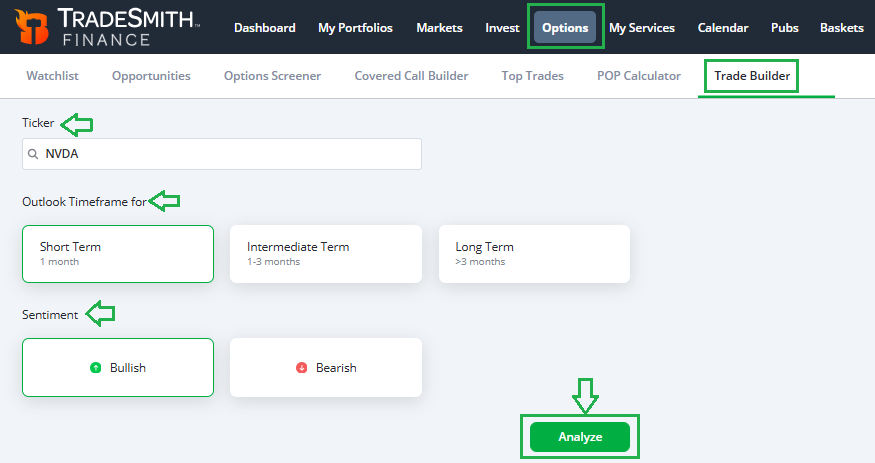
In the Ticker symbol search bar at the top left, type in any ticker – in this case, NVDA.
Next, you can choose your Outlook Timeframe:
- Short term (typically 1 month or less)
- Intermediate (about 1-3 months)
- Longer term (3 months or more)
Then, select your Sentiment view:
- Bullish if you expect the stock to rise
- Bearish if you expect the stock to fall
Finally, click on Analyze. From there, Trade Builder scans the market to identify specific options that fit your criteria.
It automatically excludes trades with low liquidity, as well as contracts affected by earnings announcements, which can add hidden risks.
Displayed below are the results you’ll see for NVDA, which may have changed a bit since I ran this the other day:
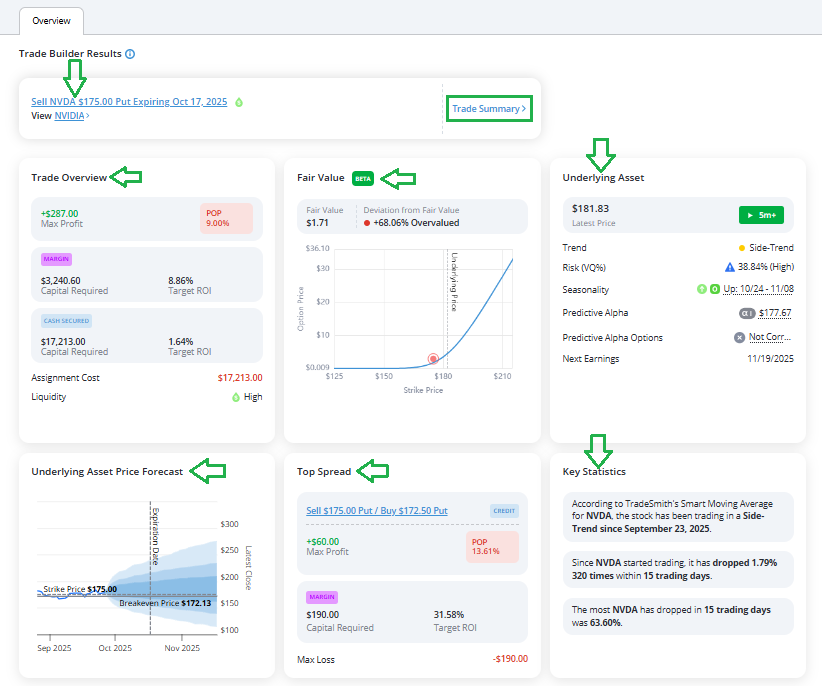
The results are in an easy-to-view format that includes several valuable sections to help you quickly and easily evaluate a potential option trade:
- Trade Summary
- Trade Overview
- Fair Valuation
- Underlying Asset Price Forecast
- Top spread (if available)
- Underlying Asset
- Key Statistics
Let’s take a closer look at NVDA’s results section by section to understand all the detailed insights at your disposal.

As you can see above, the top Trade Builder results section includes the best suggested trade according to our fair valuation analysis.
In this case, the suggested trade is…
Sell the NVDA $175 Put Expiring Oct. 17, 2025
Click on the Trade Summary> icon to the left of the trade to get even more details and insights.
Next, you’ll notice the Trade Overview and Fair Value section. This gives you all the vital facts about this option trade that helps you make a more informed decision:
- $287 Max Profit – the option premium amount you collect up front.
- $3,240.60 Capital Required – how much money you’ll need in a standard margin account.
- 8.86% Target ROI – the return on investment with the trade
You’ll also notice that the capital required is larger ($17,213) if you place the trade without margin in a standard cash-secured account (which reduces ROI to 1.64%), the same as the assignment cost.
On the left is the Fair Value graph, indicating the fair value estimate for this option, according to our model, is only $1.71 per contract ($171 total).
But you’re able to collect $2.87 per contract ($287). The option is overvalued by roughly 68% according to our model.
So, you’re getting more than your money’s worth for selling this option.
Now, scroll down a bit to the next sections.
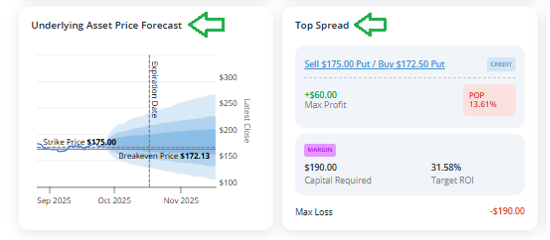
On the left, the Underlying Price Forecast tells you at a glance the range of likely prices for NVDA shares up to the option expiration date and beyond.
As you can see, your breakeven price on this trade is $172.13, which means NVDA shares would need to close below that level at or before expiration to be assigned and the trade be unprofitable.
On the right is the Top Spread (if available). This kind of option trade isn’t as complicated as it may sound.
A spread simply combines selling one put option (in this case, the NVDA $175 Put Expiring Oct. 17, 2025) and buying another put at a lower strike price (in this case, the NVDA $172.50 Put, also expiring Oct. 27, 2025).
The advantage of the spread is to dramatically reduce your capital requirement to place the trade, but it also lowers the max profit.
In this case, you would earn $59 in max profit, but the capital required in a margin account is only $191.
This makes option spreads more accessible for those just getting started with options, or folks with less account capital, or who are just more conservative.
Key Information on NVDA
Moving on to the far left of the results page, you’ll find even more key information in the Underlying Asset section. For NVDA, this includes:
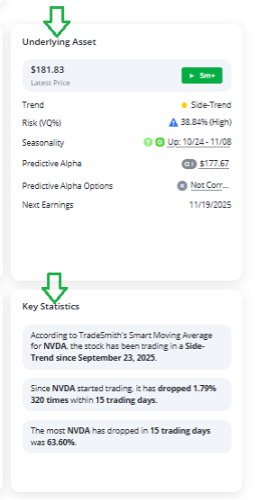
- Latest Price: $182.55 – and to the left of price, you’ll see the current Health rating. NVDA is in the Green Zone for over five months.
- Trend: NVDA shares are currently in a Side-Trend
- Risk (VQ%): At 38.84%, NVDA is considered High risk based on our unique volatility metric.
- Seasonality: Our proprietary seasonality tool tells you NVDA is expected to moveUp from 10/24 – 11/08, that’s ideal when selling puts.
- Predictive Alpha: Our AI-powered tools expect NVDA to rise 1.9% to $183.75 by mid-October. Again, that’s a plus when selling puts.
- Predictive Alpha Options: If there is another option trade that qualifies for our Predictive Alpha metrics, it will display here.
- Next Earnings: NVDA reports earnings on 11/19/2025. Option traders may want to avoid an option that expires on or just after an earnings data due to the volatility that often occurs.
Finally, the Key Statistics provides you with vital info about how NVDA has traded in the recent past.
While it can’t predict the future or the exact outcome of each trade, our Options360 Trade Builder and Fair Valuation tools can help you uncover hidden opportunities to profit.
These tools can alert you to potential trades where current option prices are either at a premium or a discount compared to what the historical data and probability suggest is the “right” price.
Mike Burnick’s Bottom Line: Knowing whether an option is over- or undervalued before placing a trade can make all the difference to your success. And with these TradeSmith tools, you can quickly recognize opportunities to buy low (undervalued options) and sell high (overvalued options) – allowing you to consistently earn a bit of extra income from the markets.
Good investing,
Mike Burnick
Senior Analyst, TradeSmith
P.S. You’ve seen the Fair Value tool in action now – and with the help of Trade Builder, you can find out if the option you’re looking at is too expensive or right at the sweet spot for you to have the chance to grab a quick profit.
But believe me when I say that just seeing how the tool works – and how it could have made you money via examples and backtests – is not enough. Not in this market.
So let me show you a real-life trade that you could have executed…
In mid-August, the financial software company, an options trade on Intuit Inc. (INTU) was flagged on the fair value tool.
About an hour before the close on Friday, Aug. 22, this trade soared in value – snaring a 100% gain in less than one day!
As you can see in the chart below, INTU stock itself did not experience a huge change in value – up or down – but nevertheless, this trade scored a triple-digit profit.

For context, if you had invested in INTU on Jan. 2 of this year…
And exited on Aug. 22…
You would have only seen a 6.40% return.
In seven and a half months – not even a double-digit return to speak of.
But in mere hours…
Using the fair value tool could have doubled your money.
And this 100% gain isn’t an anomaly.
In just the last two months, trades flagged by the fair value tool gained 112%, 172%, and 519% in a matter of hours.
So, it’s no wonder that some are saying this innovation could change the way you trade… forever.
See the fair value tool in action – and learn how you can use it for yourself – right here for a limited time.