Cycle Secrets: 2 Stocks to Watch from Our Latest Breakthrough
The stock market has had two good years, and further highs are expected.
But history teaches one big lesson: nothing lasts forever.
After 2022’s market crash, we saw nearly every sector of the market make a powerful recovery: in 2023 and 2024, the S&P 500 Index (SPX) rallied hard for two years in a row – booking back-to-back annual gains of over 20%.
It made for two years of easy wins… But the good times might be coming to an end.
Historically, the S&P 500 loses steam after delivering two years of strong returns: after notching back-to-back wins like these, historical data suggests that third-year returns average around 12%… nearly half as much as we’ve seen over the last two years.
And with market volatility rising by the day, it’s getting harder and harder to grow your portfolio.
There’s a risk of a new trade war…
Interest rates could run higher again…
And some golden-child tech stocks are losing their luster, too.
However, that doesn’t mean you should cash out and run for the hills – not at all. It just means that this year, succeeding in the market means taking a smarter approach.
Recently, our team at TradeSmith unveiled the biggest investment breakthrough in our firm’s 20-year history: A powerful new way to spot the biggest moves on more than 5,000 different stocks – timed to the DAY – and a data-driven trading strategy to capitalize on them, with 83% backtested accuracy.
We’ve harnessed DECADES of historical data to reveal one of the market’s biggest secrets, and it’s unlocked an opportunity to apply our latest breakthrough to your portfolio… an opportunity that could double your money in 2025 and crush conventional investing strategies – whether 2025 brings a bull market or the start of a long, bearish, market winter. And we’re thrilled to share it with you.
Here’s how it works…
The Market’s Secret “Green Days”
What are your plans for May 19?
Maybe you’ll play golf… go to work… or just watch TV.
Whatever your plans, do one thing that day: Buy Tesla (TSLA).
Why? Because May 19 is Tesla’s “green day.”
Consider this:
What if you knew you could buy Tesla stock every single year on exactly May 19…
And every single year, make a gain in just 55 days that’s the equivalent of almost tripling your money over an entire year?
What if you knew this trade had worked for TSLA’s entire lifetime on the market, going back 15 years – through bull and bear markets – 100% of the time?
A jump so predictable… that you could count on Tesla stock going up on exactly May 19 this year, next year, and every year after that – with a 100% historical accuracy, even if the markets are crashing?
Well, if you’re like us, you’d set a reminder to buy Tesla on May 19!
Here’s your reason why:
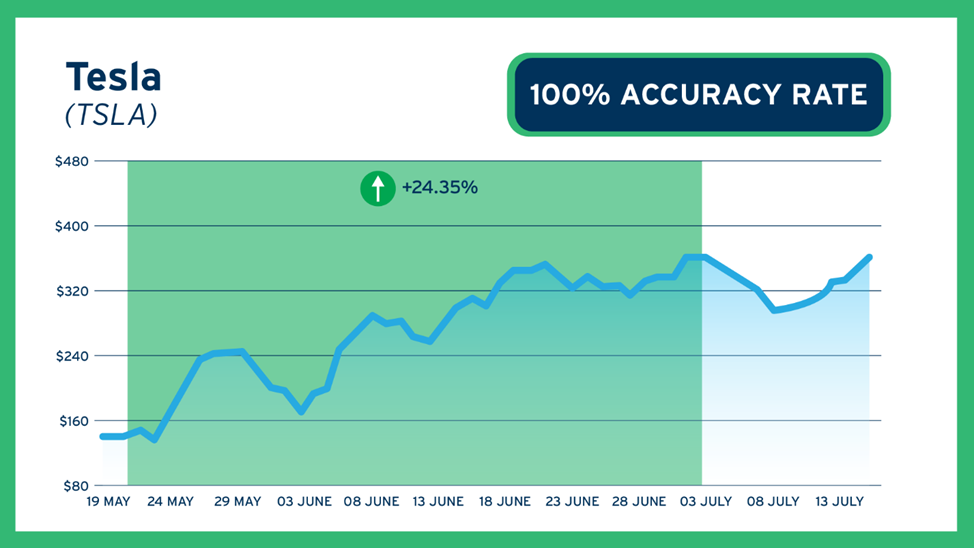
Every May 19, for the past 15 years, Tesla has entered what our team calls a “green zone”. And after entering that green zone, it went on to rise an average of 24% over the next 55 days.
Apples-to-apples with long-term investing, that’s equivalent to making 161% across an entire year. And we make that comparison for a very exciting reason.
Think about that for a second:
You could ignore the other 310 days of the year… and still have the chance to make enough money to crush the market’s average annual returns two-fold.
And keep in mind, we’re talking about simply buying the stock on the exact same day, every year, and holding for just 55 days. Nothing fancy.
No complex strategies, no precise timing needed.
We know what you’re thinking:
“Wait a minute… Let me get this straight. You’re saying that EVERY SINGLE YEAR on May 19, Tesla stock shoots up, for apparently no reason? And it’s held true for 15 years?”
Yes! That’s exactly what we’re saying.
And it’s not just Tesla repeating these patterns…
This phenomenon occurs with thousands of stocks each year… each with its own particular “green day.”
These green days – and the green zones they mark the beginning of – are one of the market’s best-kept stock secrets: repeating patterns of movement laying hidden in decades of historical pricing data. You’d have to crunch millions of data points to find them… and that’s a monumental task for most investors.
But TradeSmith’s researchers have cracked the code, and using the latest in machine learning algorithms our team has developed a powerful system that can reveal these hidden patterns quickly – for thousands of different stocks.
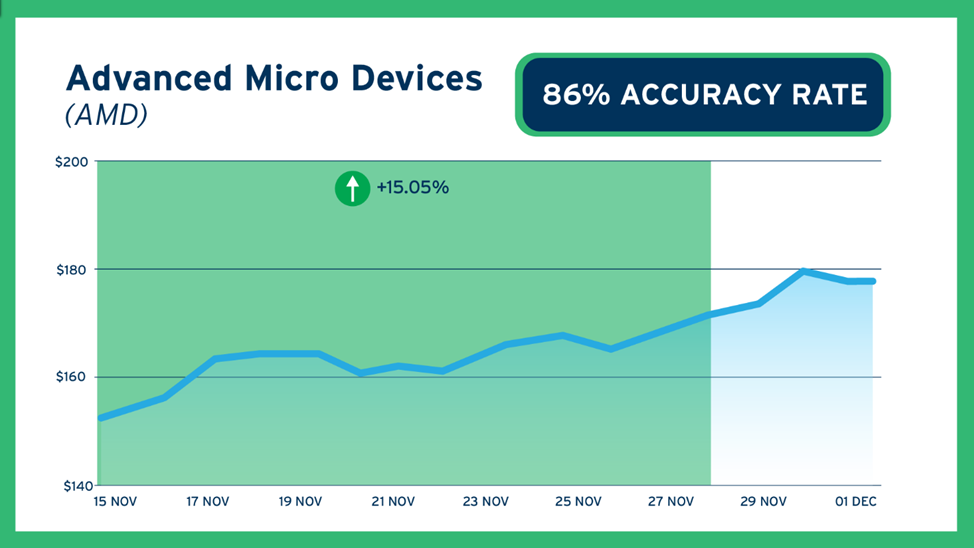
- For example, if you’re planning to buy Advanced Micro Devices (AMD) this year, our team suggests you do it on November 16.
Because starting on that exact date, AMD’s price begins to rise nearly every single year, with an 86% accuracy rate… for a gain in just 20 days that’s equivalent to more than doubling your money over a year. See the green zone?
- Or consider March 14…
If you do nothing else that day, buy Lululemon (LULU).
87% of the time, it’s gone up on that date – across more than a decade.
- Or how about Dollarama (DLMAF)?
This Canadian company has a “green zone” that begins March 23, with another 100% historical success rate.
All these green zones produce winning trades – at a rate fast enough to potentially double your portfolio over the next 12 months.
We’ve developed a groundbreaking new system to pinpoint the dates of the calendar when these market patterns begin – year after year – and it’s produced winning trade after winning trade… with an 83% backtested success rate.
It’s the center of our latest trading strategy, unveiled by our CEO Keith Kaplan in early January: A cutting-edge market-scanning system and a model portfolio that would have turned every $10,000 invested into $85,700 in our backtests, crushing the S&P 500 by an average of 99%…
And here’s the best part…
This even works on the downside!
Just as we can predict the optimal date to buy a stock, we can use the same algorithm to predict when to SELL or AVOID it…
And the trading strategy powered by this system works over decades of different market conditions. From the longest bull markets to the most brutal selloffs…
Our system harnesses decades of historical data to find the right moment to take action.
Our CEO, Keith Kaplan, gave our programmers a challenge:
We already knew how to find the optimal dates to buy a stock…
So, he asked, “Can we find the exact date to sell or avoid a stock?”
In other words: Instead of “green zones,” we wanted to find “red zones.” The opposite of a green day – the exact dates when a stock has a known and predictable history of plummeting.
And sure enough, we found them. Here’s what we came back to Keith with:
Consider Wynn Resorts (WYNN).
It’s the brainchild of billionaire Steve Wynn. The stock is up six-fold overall since its listing in 2002… but as with many stocks, it hasn’t been a smooth ride to get there.
For example, at one point it crashed 62% after Steve Wynn was forced to resign, which scared a lot of investors into selling out.
But it turns out WYNN falls each year, regardless of news…
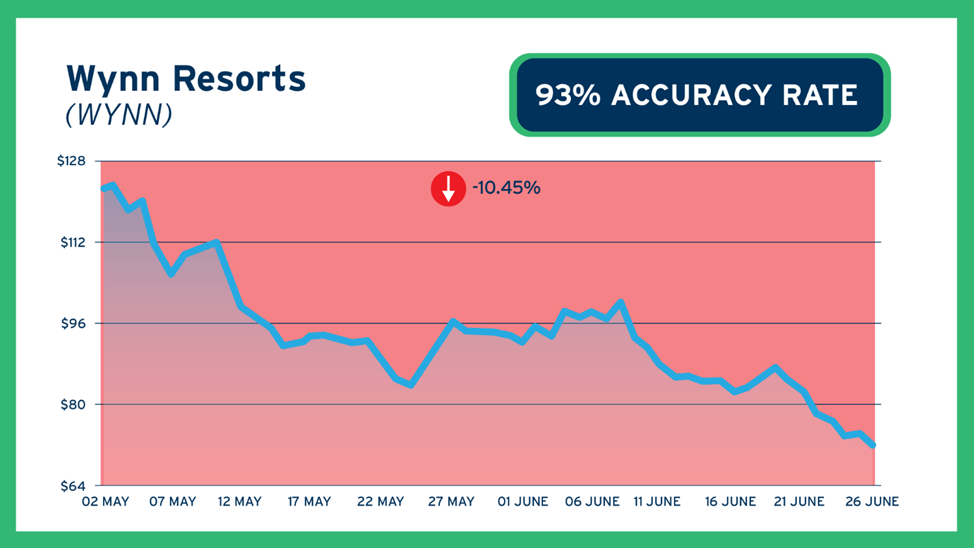
Wynn Resorts has a “red day” on May 2.
Over the last 15 years, Wynn Resorts has fallen by an average of 10% over the next 55 days following that date. See the red zone?
It happens 93% of the time, year after year.
This was true in 2018, when Steve Wynn was forced out…
And it happened just the same back in 2020 – during the market’s greatest 50-day rally in history!
Good times or bad, May 2 is NOT the day to buy WYNN.
As you can imagine, this is valuable information to have, for anyone who might be holding the stock – or thinking of buying it at a good price.
Don’t buy it in May. Our results are crystal-clear: Wait until July.
Or maybe you’re thinking of buying Flagstar Financial (FLG), a bank holding company?
- Whatever you do, DON’T buy it on March 21.
100% of the time, it’s fallen by an average of 5% over the following 30 days.
Now, again, we know what you’re thinking…
All of this sounds fascinating. And if the data is true, this changes everything…
But what happens during a market-wide selloff – when the entire financial system goes out of whack? What happens when everything crashes, and crashes hard?
Our Breakthrough Strategy Still Works.
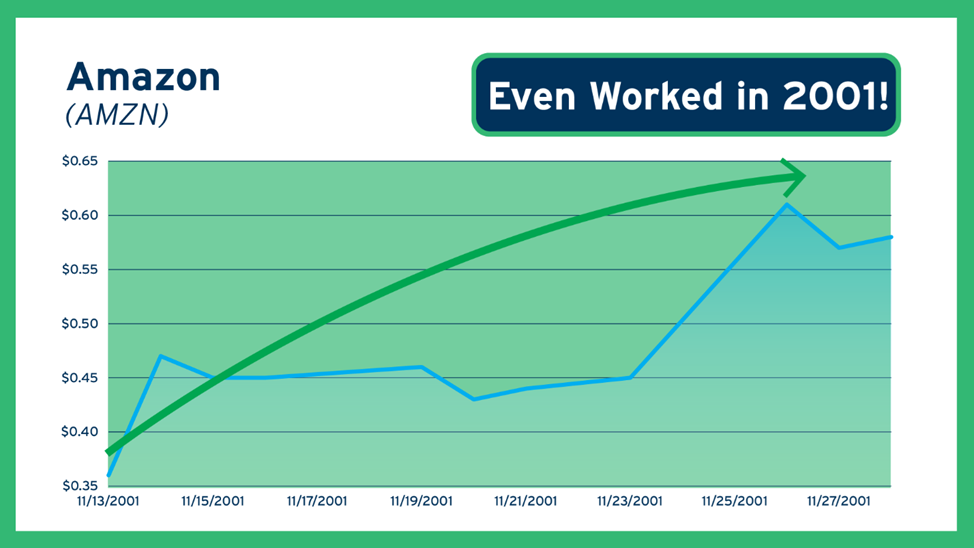
Let’s take Amazon (AMZN) as an example.
It’s seen plenty of market booms over its history… and plenty of market busts. It lost over 90% of its value after the dot-com bubble burst in 2000.
Well, Amazon’s “green day” is November 11.
If you buy into Amazon on November 11… 86% of the time, you’ll see the stock go up an average of about 9% over the next 15 days. That’s been true for 28 years.
At that rate, just buying, holding, and selling AMZN shares for that period each year, you’d average almost 10 times more money each year than the S&P 500.
And that green zone holds true for Amazon even during a broad sell-off. Bull market or bear market, good earnings or bad.
It sounds too good to be true, and if you were using conventional analysis, that’s a fair conclusion to make.
For example, when markets crash… it usually means earnings are bad, or the economy is weak, or a macro event just blew through the financial grid… and so on.
In those conditions, you couldn’t possibly expect a stock to rise – most wouldn’t.
But skeptics spend early November watching AMZN defy the odds, year after year.
Even during the dot-com crash – when Amazon was the poster child of dot-com catastrophe – guess what happened to the stock when it entered its green zone on November 11, 2001?
It went up!
The country could be entering World War III, as far as our data is concerned… But as long as the markets are open, we would expect green zones like this to hold true. Based on our 33-year study, that’s been the case 83% of the time.
The system we’ve developed to find these green and red zones ignores all the conventional metrics – and in sticking to the historical data, and following these repeating patterns in the market? It’s succeeded far beyond what we could’ve imagined.
And to test the strategy, we used data that includes both the good times and ALL the horrible things that have happened over the past 33 years.
Including the Gulf War, four bear markets, and the collapse of Enron…
September 11, the Fannie and Freddie bailout, and the COVID crash…
And our strategy kept winning trade after trade, through it all.
Remember: This system works on over 5,000 different stocks. And it doesn’t just use the biggest names on the market.
Consider 2022, when we saw the biggest selloff in 50 years…
With the Fed jacking up interest rates to historic highs, it looked like bad news for Paysign (PAYS), a banking firm.
But guess what happened on its green day of January 14 that year?
The stock went up.
And that’s because, 86% of the time, Paysign has gone up by an average of 33% over the next 25 days during the green zone beginning January 14.

The bottom line is: Trading these seasonal patterns works in any kind of market.
It’s a revolutionary development, even compared to the rest of TradeSmith’s suite of powerful software and investment tools. Our team truly believe we’ve created the ultimate trading strategy – something that could change investing and trading forever.
And we want you to make the most of it. In TradeSmith’s 20-year history, it’s our most powerful development yet.
And 2025 could present the best opportunity to use it we’ve ever seen.
So, to get you ready, we’re giving you a taste of our powerful Trade Cycles Seasonality tool, on behalf of our CEO Keith… along with the names of two stocks on the verge of a major move, selected by our system.
Stock #1: Broadcom (AVGO)
By now, we’re all familiar with Nvidia’s meteoric rise – and how it’s powered the AI movement to new heights over the last two years.
On the wings of the AI movement, the semiconductor industry has exploded in popularity… and Broadcom has benefited from it handsomely: since 2022, the stock is up over 300%.
But even as the AI trade is rattled by outside threats, AVGO can still go higher:
Every year for the past 15 years, AVGO has seen six “green zone” bullish seasonal windows, with one that shows average gains of nearly 13% in about a month.
And these have held true through bull or bear markets for at least 80% of the time over the last 15 years!
At that rate, you’d more than double your money over the course of a year by finding trades of this caliber over and over again – which is what our system allows you to do.
And here’s the best part…
You can also use this strategy to know when to avoid a stock you may be considering, too.
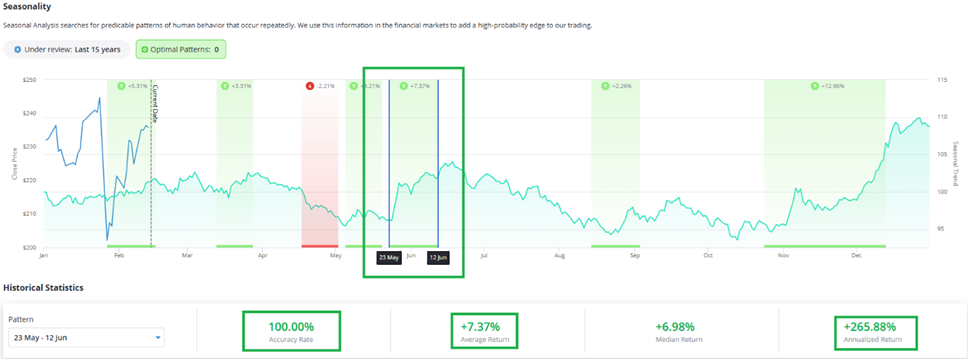
Stock #2: Las Vegas Sands (LVS)
Here’s another stock in our system that not only shows you the upcoming bullish windows, but also bearish windows…
Take a look:

86% of the time, beginning May 2, the stock of this casino and resort company has gone down by an average of 7% over the next two months.
In other words, if you’re thinking of buying into Las Vegas Sands (LVS)…
Don’t do it between May and June! It’s a bad bet.
Make These Market Secrets Your Own
If we wanted, we could use these seasonal patterns to run a massive hedge fund.
But here at TradeSmith, we’ve made it our mission to put the power of data into the hands of the average investor, and the average trader – to give everyone access to powerful tools just like this.
And as part of that effort, we’ve created a trading system that turns these green and red zones into actionable trades – trades we can send straight to your inbox, right as the historical pattern opens.
We call it Seasonal Edge… and it’s by far the biggest breakthrough in our firm’s 20-year history. And that comes after our existing algorithms have been profiled by CNN, CNBC, and the Wall Street Journal.
With our market-scanning Trade Cycles system, you can type in any of over 5,000 different stocks to foresee their biggest jumps this year, to the day… along with the start of the red zones when you should avoid them.
Our team has never been more excited to share a new development.
We think it could change the way you think about making money, forever.
Regards,
Team TradeSmith
ABOUT TRADESMITH
TradeSmith is a financial technology company profiled by The Economist, whose innovations help 72,000 people in 86 countries track $30 billion.
Led by our CEO, Keith Kaplan, TradeSmith is best-known for a proprietary algorithm that pinpoints the optimal time to buy and sell any investment in your portfolio – and how much money to put into each position – to potentially see a multi-fold increase in returns.
In fact, this algorithm – designed by Keith himself – could’ve outperformed many of Wall Street’s most successful managers in backtests. Including David Einhorn, John Paulson, and a $1.8 billion manager whose performance would have improved by 1,714%:

TradeSmith’s mission is to empower the average investor, by providing hedge fund-grade tools and software to power up their portfolios. Notably, our firm once held a live event, where we asked ordinary people to run their portfolios through our algorithms. One man discovered that his $46,271 profit would’ve nearly 10x’d into $433,806.
This year, TradeSmith is stepping forward with a system that takes ALL of its previous work to the highest level yet. A powerful new way to handle your cash in 2025… by using a simple online calendar.
Keith Kaplan calls it the culmination of his career – and the most exciting breakthrough he and his team have ever developed.
It’s the crown jewel of TradeSmith’s 20-year history… and a financial game-changer that could change your life in a volatile year.