Top 5 Stocks to Avoid Right Now
There’s a saying that goes “a rising tide lifts all boats.”
Coined by John F. Kennedy, we’ve seen this adage in action in the markets recently. Following one of the most contentious elections in history, the market soared – stocks, currencies, and other assets alike.
In fact, year to date, the S&P 500 has soared 27.58%.
You can see it for yourself in the chart below:
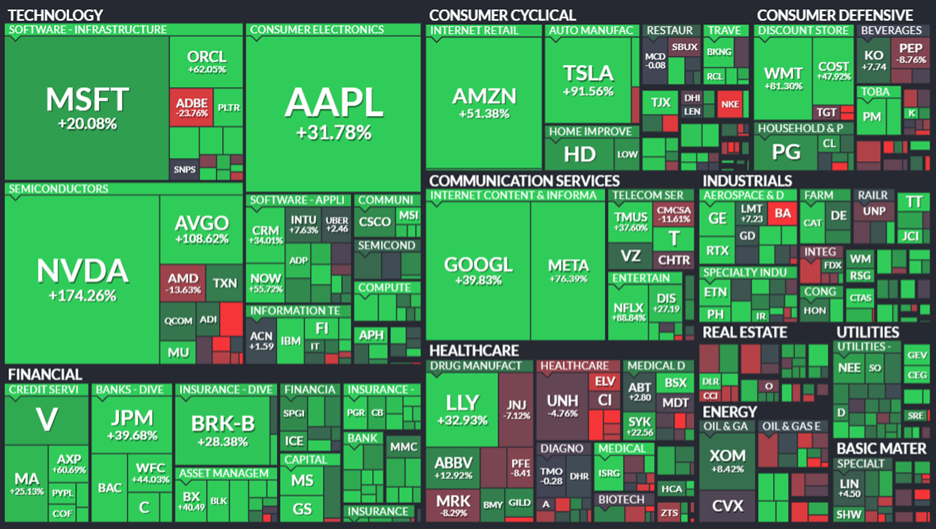
Source: finviz.com
It’s hard to be pessimistic with a picture like that!
But the ugly truth is, the tide only rises for so long before it begins to ebb – and so, too, will some of the stocks that have been on a tear recently.
While this much green looks great at first blush, many of these stocks you see here are about to sink.
Today, you’ll learn about the five most dangerous stocks out there right now.
Flagged by TradeSmith’s proprietary TradeStops technology, these stocks are ticking time bombs…
And when they detonate, they could crater your portfolio.
If you’d held onto stocks that were this dangerous, according to TradeStops in 2022, you could’ve lost up to 61% of your money… and up to a sickening 80% in 2020.
So, when we say these stocks are bad news, we mean it without an shred of doubt.
But don’t just take our word for it…
Let us show you.
Gauge the Health of Any Stock with This Simple Tool
At TradeSmith, technology is our “thing.”
Founded in 2005 as a simple way to track positions through trailing stops, TradeSmith was comprised of a team of data scientists, mathematicians, and software engineers.
Our mission was to provide an edge in the market to self-directed investors – and nearly 20 years since our inception, that one useful feature has blossomed into a suite of risk-management and portfolio-analysis tools that all work to make you a better, smarter, more informed investor – called TradeStops.
And the heart of TradeStops is the Volatility Quotient (or “VQ” for short).
VQ provides customized trailing stops and helps determine how many shares to buy for any security according to risk. Historical price data for any given security determines its normal volatility or risk. We use three years of price data, with the past year more heavily weighted than the previous two years’ data.
Now, the VQ is dynamic and is updated on a weekly basis. But to understand what the number means, here’s a quick breakdown:
- Up to 15% = Low Risk
- 15% – 30% = Medium Risk
- 30% – 50% = High Risk
- 50% and above = Sky-High Risk
For example, let’s look at one of the most popular stocks on the market: Amazon.com Inc. (AMZN).
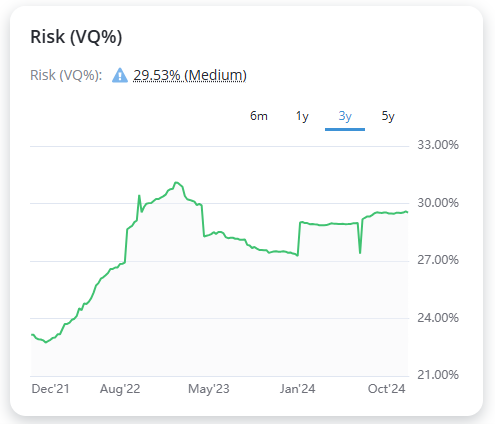
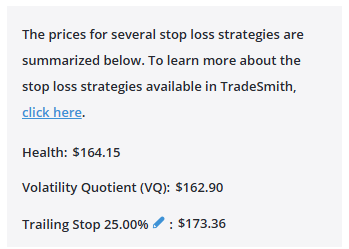
In mid-December 2024, Amazon carries a medium (bordering medium-high) VQ of 29.53%. And right now, the suggested stop-loss provided by TradeStops is $162.90. (You’ll see we also provide a 25% trailing stop as well.)
If you owned Amazon, it would be extremely simple to input this stop-loss or trailing stop amount and go about your day.
But at TradeSmith, we always aim for better, smarter, and stronger data – to make you a better, smarter and stronger investor…
So, we bolstered our VQ readings with something called the Health Indicator.
This simple “red means stop, green means go” tool tells you, with just a glance, whether a given asset is a buy, sell, or a hold.
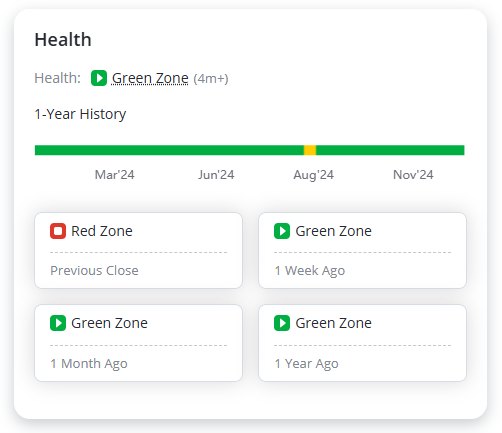
Still using Amazon as our example, the stock is currently in the Green Zone overall.
The Health Zones are broken down as follows:
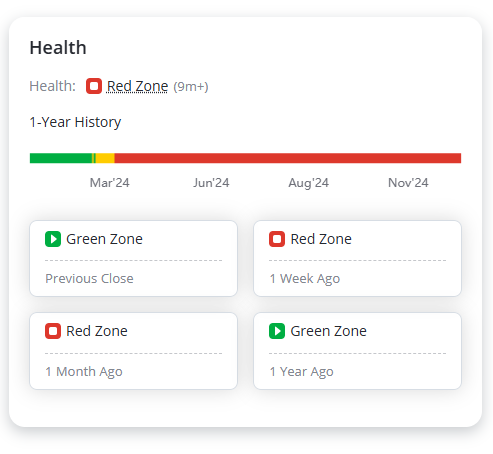
- The Health Indicator Green Zone is the strongest and “healthiest” state. It indicates an investment has risen significantly off a major bottom, is performing well, and is experiencing only minor corrections. So, even though Amazon may toe the line of medium-high risk, it is still a very healthy stock.
- The Health Indicator Yellow Zone indicates an investment has sustained a significant correction but is still moving within the boundaries of its expected volatility. It hasn’t yet been stopped out but is getting close to an “unhealthy” state. It’s telling you to be cautious, just like a yellow traffic light.
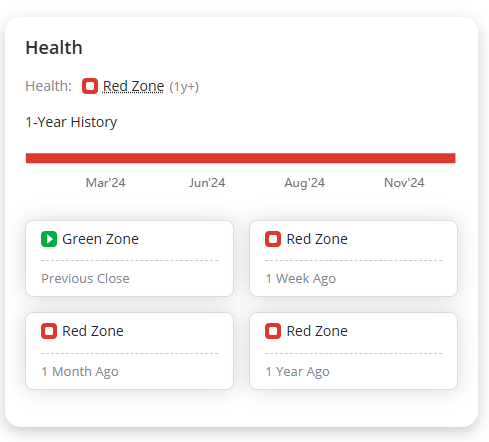
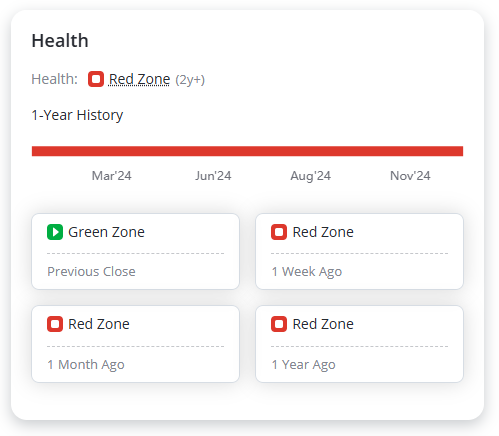
- Finally, the Health Indicator Red Zone indicates an investment has corrected more than it should have based on its expected volatility. It’s no longer “healthy.”
You’ll see that the previous close for Amazon at the time of this writing was in the red zone, indicating a bit more volatility than normal, but it does not affect the overall forecast of the stock.
Red Means “Stop!”
Now, using this unique combination of tools we’ve spent two decades perfecting, we were able to pull a list of the top five worst stocks to own right now.
If you don’t currently own these stocks, you’re ahead of the game.
But if these snakes in the grass are lurking in your portfolio, it’s time to sell… before they bite.
1. PepsiCo Inc. (PEP)
2. Dollar General Corp. (DG)

3. The Estée Launder Cos. Inc. (EL)
4. Sirius XM Holdings Inc. (SIRI)
5. Moderna Inc. (MRNA)

Moving Forward
Just like your physical health, the health of a stock is invaluable.
Even if a stock may see a rally in its price, the underlying fundamentals and volatility contribute to its overall portrait.
These five stocks I’ve shown you today may very well be the most dangerous ones to own right now, and by harnessing the power of our TradeStops portfolio-analysis tools, you can become a more-informed – and potentially wealthier! – investor in the long run.
Sincerely,
The TradeSmith Research Team
P.S. If you have questions regarding your TradeSmith membership, please reach out to your Customer Support Team at 1-866-385-2076 or [email protected] Monday through Friday, 9:00 a.m. to 5:00 p.m. Eastern.