

My career in the investment business has been very good to me, but I’m still a cheapskate at heart.
Or to put it a more polite way, I love spotting bargains. I guess that’s why I’m a value investor.
At home I’m a compulsive comparison shopper. If I need a new big-screen tv before football season starts, I don’t mind spending time online comparing smart tv brands and prices, one against another, until I find a real bargain.
And when it comes to investing, you and I can do the same thing. Comparison shop for trading and investment ideas available at bargain prices!
We just made it easier for you to comparison shop for investments right from the comfort of your TradeSmith Finance platform.
And here’s a quick case in point.
I’ve been pointing out for some time that small-cap stocks are dirt-cheap and widely hated.
In fact, as you can see in the chart below, small caps have not been at this big of a discount for almost 25 years!
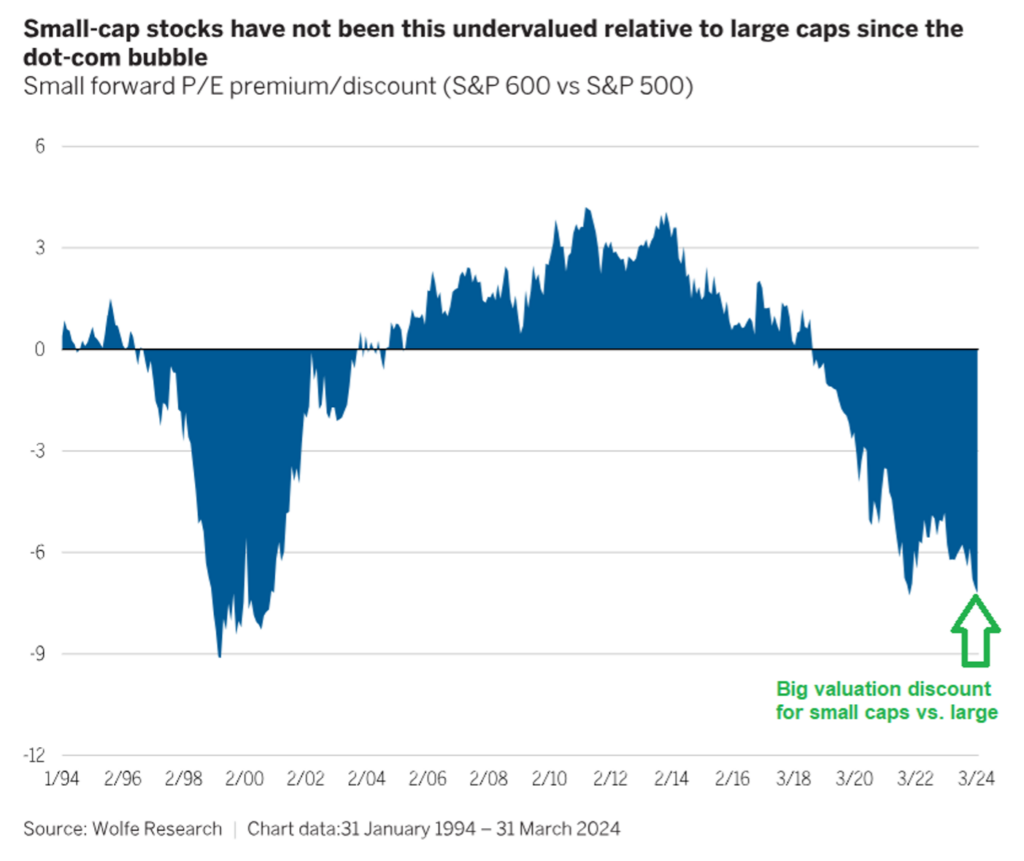
Over many decades of data, small-cap stocks have outperformed the S&P 500. But in recent years, large caps took a big lead over small caps.
That has led to a 30% price-to-earnings-ratio discount for small caps compared to large, the widest discount since 2000.
So, we know small caps are cheap and despised by investors today… and now they’re in an uptrend relative to the S&P 500. You can see it for yourself with TradeSmith’s comparison tool, as I’ll show you.
But first, let me take a small step back and show you how to make the most of this valuable Chart Ticker Comparison feature, which we just enhanced and made available to all TradeSmith members.
Comparing Two or More Tickers in One Chart
You can look up any ticker – stock, index, ETF, even crypto – and instantly compare it to any other. This allows you to directly compare the percentage gain of two or more stocks on an apples-to-apples basis.
As an example, I’ll compare two tech heavyweights: Microsoft (MSFT) and Apple (AAPL). Here’s how to do it.
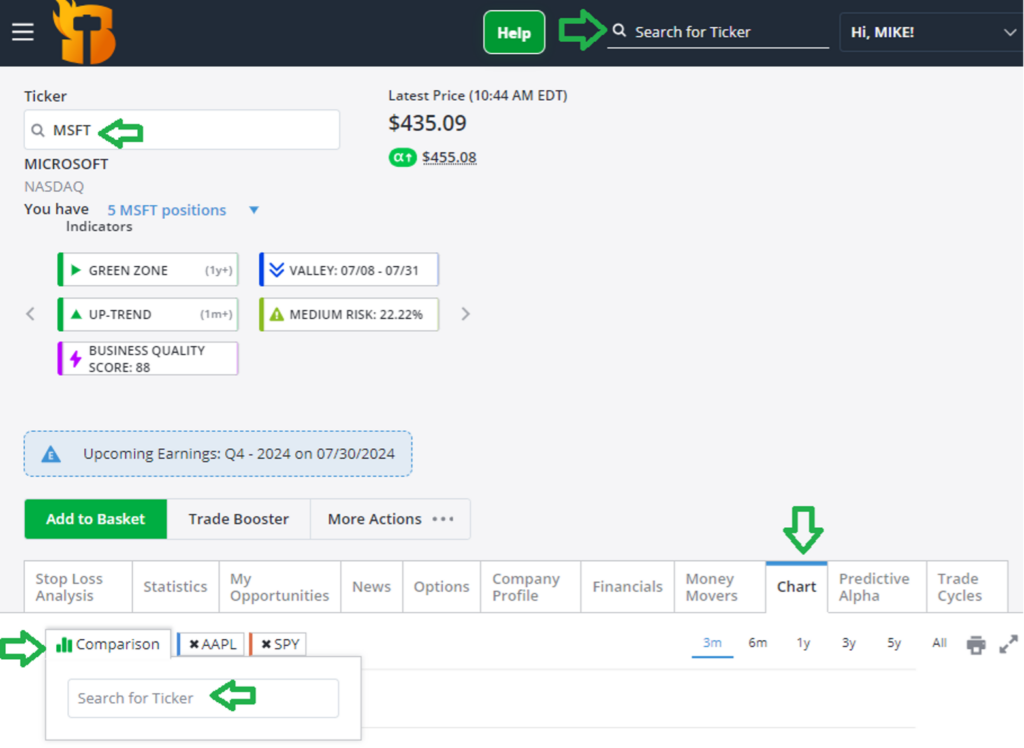
Look up MSFT using the Search for Ticker box at the top right of the TradeSmith Finance platform.
Now click on the Chart tab, then click on the Comparison button within the top left of the chart.
Next, in the new Search for Ticker box, enter any other ticker symbol (in this case AAPL and the S&P 500 Index ETF, SPY, for a benchmark comparison) and boom.
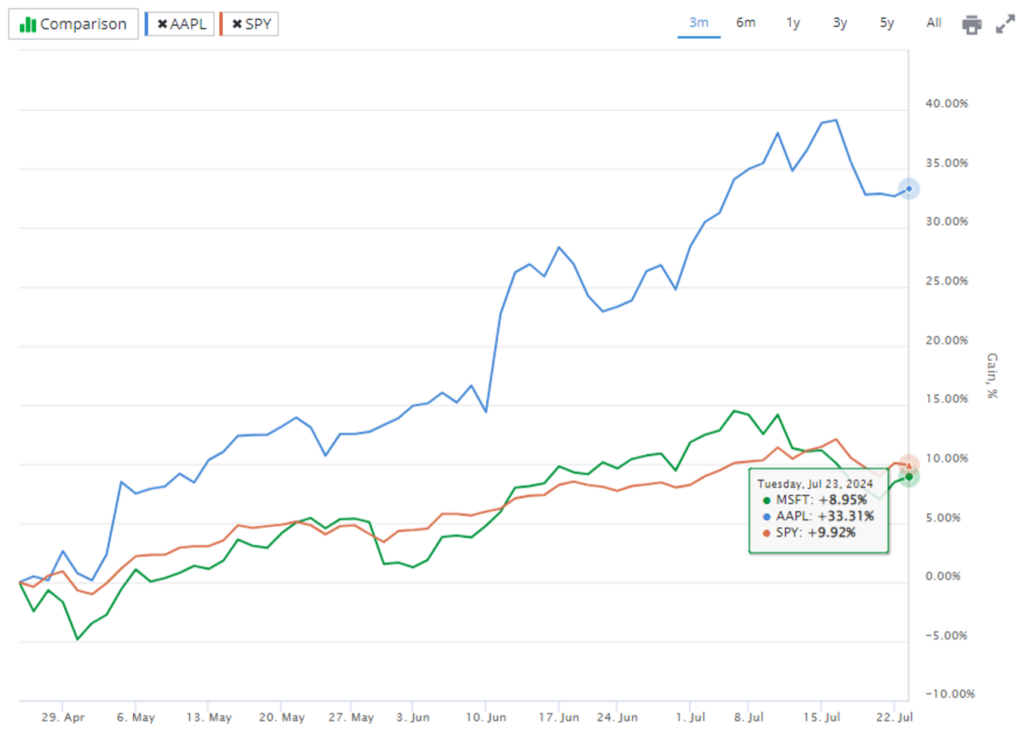
You have a clear percent-gain comparison chart of the two stocks and SPY. Plus you can enter up to six tickers for convenient comparison shopping.
I chose to compare the last three months, but you can select any time frame (3m, 6m, 1y, 3y, 5y, or All). Our system calculates the percentage gain based on the time frame you selected, with the starting point at the far left of the chart.
It’s interesting to note how MSFT and SPY have largely moved together over the last three months, both up about 10%. But AAPL has performed much better, up over 30%.
If you don’t select a time frame, the chart will default all tickers you are comparing to the one with the fewest trading years.
You can also use this tool to directly compare sector ETFs. And this is where you can quickly spot shifting trends in market leadership.
Comparing Indexes, Commodities, Sector ETFs and More
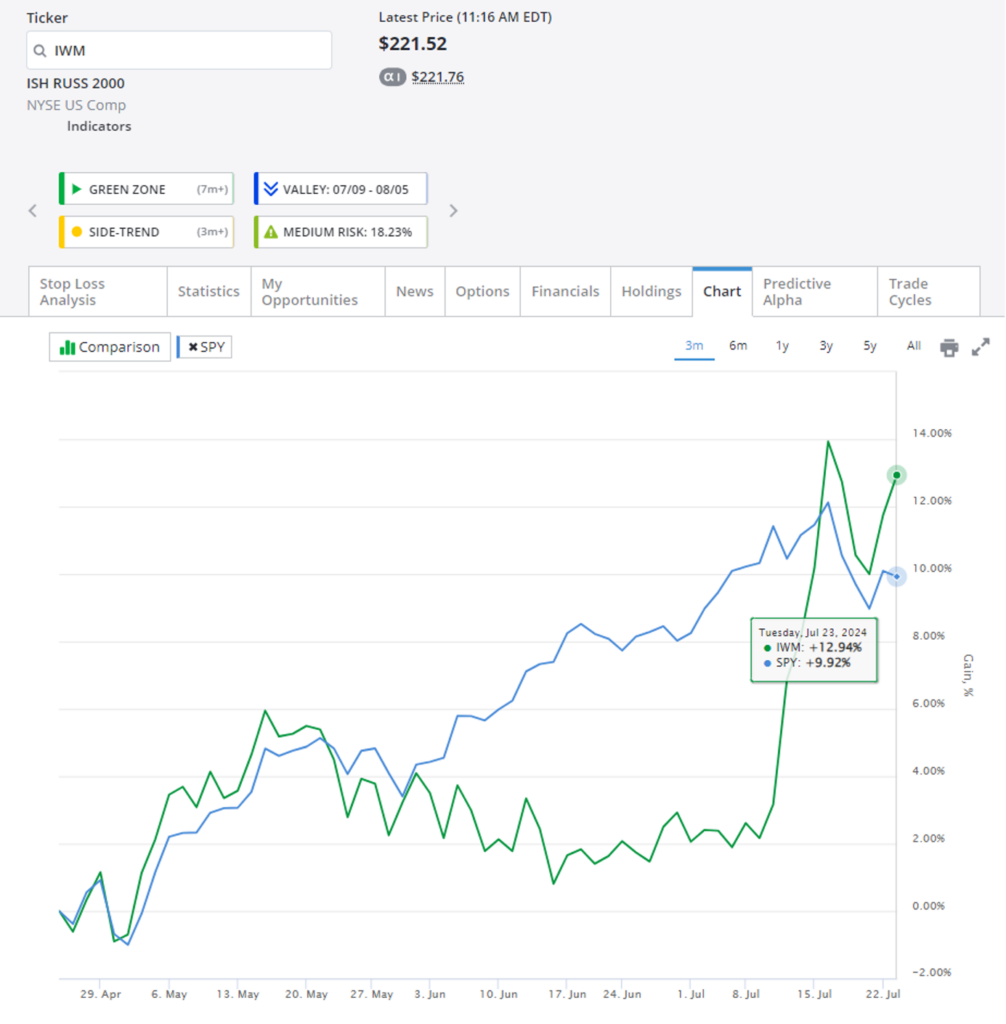
In the chart above, I’m comparing SPY to the iShares Russell 2000 ETF (IWM), which tracks the small-cap index. Notice how they moved together earlier this year, but starting in June, the large-cap SPY took off while the small-cap IWM lagged.
But two weeks ago, IWM took off like a rocket, up 11% in just five trading days. Just like that, IWM took the performance lead. And I believe this could be just the start of a new market-leading move for small-cap stocks.
If so, the handy Screener below can help you zero in on the best small-cap members of IWM according to our TradeSmith indicators.
Using the Screener to Dig Deeper
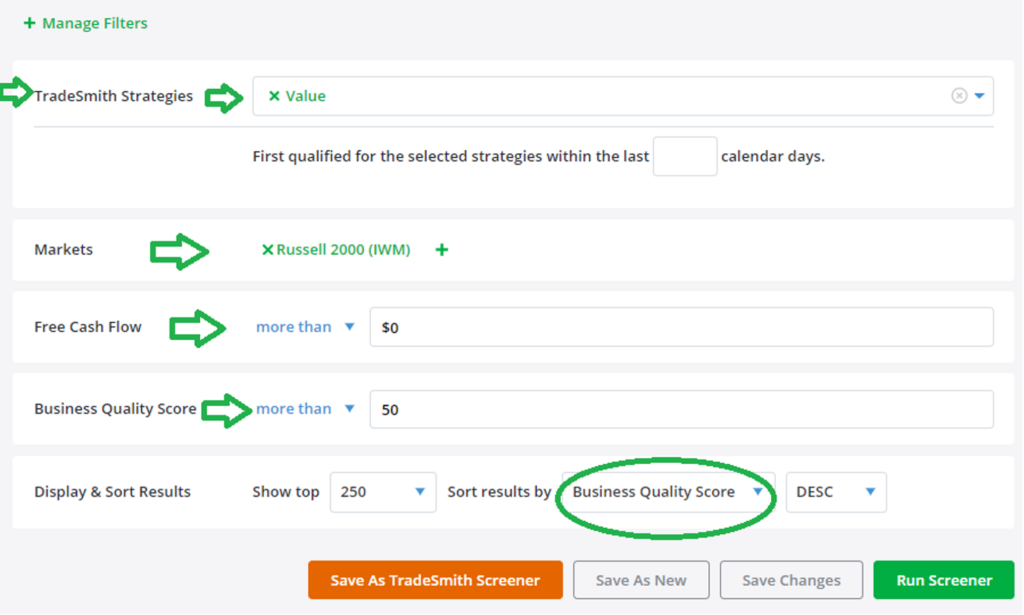
You can easily recreate this Screener. From the main menu of your TradeSmith Finance platform, click on Invest, then Screener, then the + Create new screener button.
For filters, I added TradeSmith Strategies and selected our Value strategy. Then I added Markets and selected Russell 2000 (IWM). This should give you the most undervalued stocks in the small-cap index.
Next, for our own proven TradeSmith filters, I added Free Cash Flow more than $0, so each result will be cash-flow positive. And I selected Business Quality Score (BQS) more than 50. This limits results to only IWM Value stocks that also rank in the top half by quality. Finally, I sorted results by BQS.
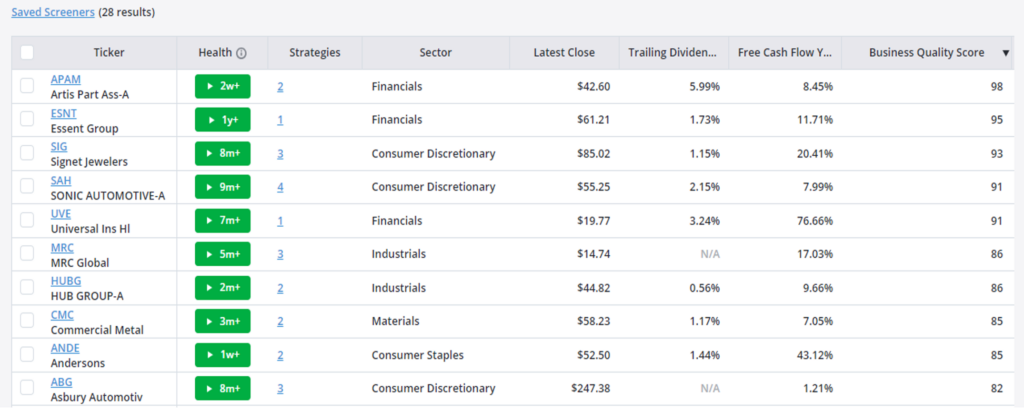
Our system gave me 28 total results, and the I’ve shown top 10 (by BQS) below.
Mike Burnick’s Bottom Line: Successful investors know how to shop for bargains in the stock market by comparing one stock to another, or to multiple stocks at once. And by comparing index ETFs to each other, you can quickly spot recent shifts in performance trends and get into the new leaders, like small caps, before all the easy money is made.
Good investing,

Mike Burnick
Senior Analyst, TradeSmith