

News outlets and Wall Street analysts are keeping a close eye on today’s midterm elections, but every day is Election Day for American consumers: We’re constantly voting with our wallets as we decide which products and services are worth spending our hard-earned money on.
And unlike the details of their midterm ballots, folks love to talk about the great deals they find.
These days, that means posting on social media platforms and leaving reviews online. With a couple of clicks, you can easily find consumers chatting about the products they love, the services they hate, and all the new products they’re eager to buy and recommend.
All of this data is available online for all to see… but with consumers making millions of new posts, comments, and reviews every minute, the challenge is turning all that raw data into something actionable.
Nearly 15 years ago, my colleagues Andy and Landon Swan built a system to do just that.
And not only did the duo figure out how to track consumer preference data in real time… they discovered a way to profit from it.
Their MegaTrends data engine – powered by the unique Social Heat Scores we discussed last week – can chew through those millions of data points from across the internet in a matter of minutes, turning those scattered conversations into usable insights.
The system can determine what people are buying on Main Street, and predict how that activity can affect stocks on the market… often before your traditional Wall Street analysts catch on.
It all makes perfect sense when you think about it: Folks on Main Street will open their wallets to buy cool new products and services months before those sales show up in the quarterly financial reports that the big money crowd on Wall Street use to find new trends.
Social Heat Scores can tell you when Main Street enthusiasm is building, well in advance of that enthusiasm impacting stock prices. And this can give you a huge, first-mover advantage – allowing you to profit from the otherwise undiscovered stocks behind the hottest new trends.
As TradeSmith Senior Analysts, Andy and Landon have spent years refining this data and the MegaTrends system that analyzes it – accumulating an enormous amount of consumer preference information in the process.
In fact, they’ve collected 23.5 terabytes of data so far.
To put that in perspective, that’s roughly 30 million full-length books worth of data – or double the collection housed in the Library of Congress!
To analyze this ocean of data, Andy and Landon use artificial intelligence to comb through online posts from Twitter/X, Facebook, Reddit, and YouTube, along with search trends, web traffic, and app downloads – all in real time.
That data is then refined, separating the random noise from the true signals – and turned into the Social Heat Score data that’s given the Swans the opportunity to zero in on winning stocks months or even years ahead of Wall Street.
Members with subscriptions to MegaTrends or Earnings Season Pass can easily find Social Heat Scores on any stock tracked in Andy and Landon’s database, just by logging into their TradeSmith Finance Home page.
Just scroll down the Home page, and you’ll find the TradeSmith Social Heat Score panel, as shown below:
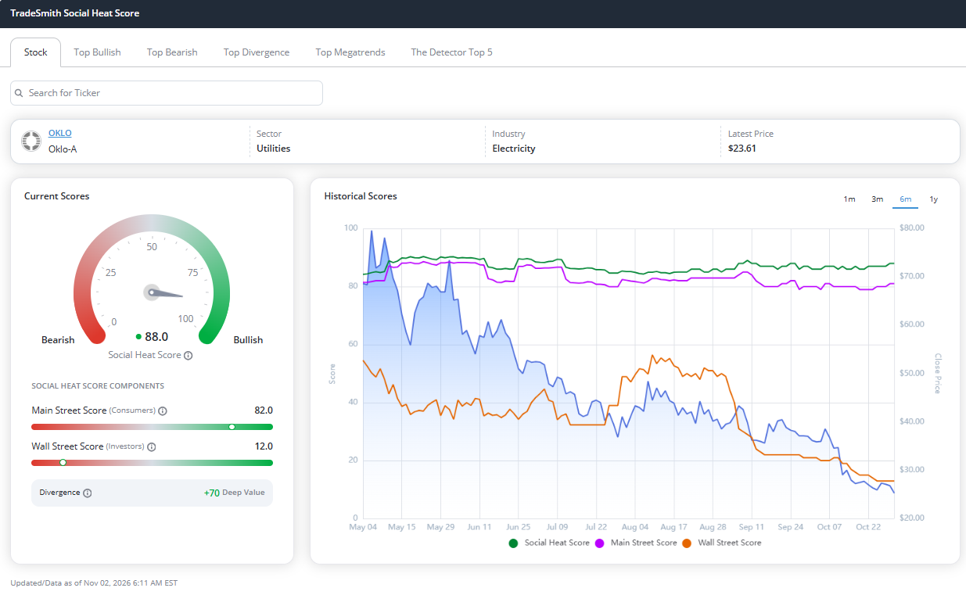
From here, simply type the ticker symbol of your choice into the Search for Ticker box to review the latest Social Heat data, straight from MegaTrends.
Shown above is the Social Heat Score data for Oklo (OKLO) a leader in small-scale nuclear power. As you can see, it has a very bullish Social Heat Score of 88 right now.
But take a closer look at the details below the Social Heat Score, and you can find an overlooked opportunity…
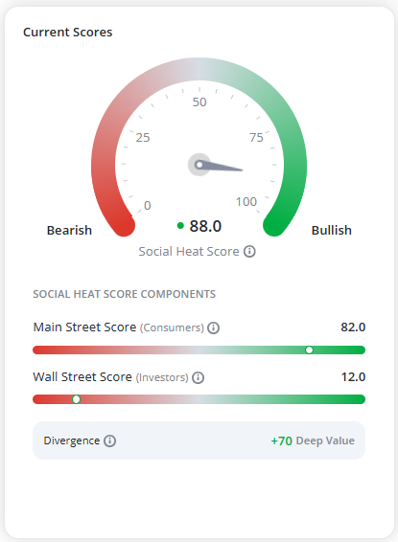
Notice how the Main Street Score listed above for OKLO is a bullish 82, while the stock’s Wall Street Score is just 12?
That means there’s a major divergence between public sentiment and Wall Street attention… And that signals a big opportunity!
As a reminder, the Main Street Score tells you how well received a company’s products and services are, according to the American consumers willing to open their wallets. A higher score is better, and this stock’s score is in the top 20%!
The Wall Street Score, on the other hand, tracks analyst and investor expectations – and OKLO’s low score means that these expectations have not yet caught up with bullish consumer demand.
The difference between these scores adds up to a 70-point positive Divergence. And divergences like this are often a sign pointing towards an undiscovered or out-of-favor stock poised to make a big move!
Let’s take a closer look at the Historical Scores chart for OKLO, found just to the right of the main Social Heat Scores. With this chart, you can easily track a stock’s Social Heat Scores and price action over time:
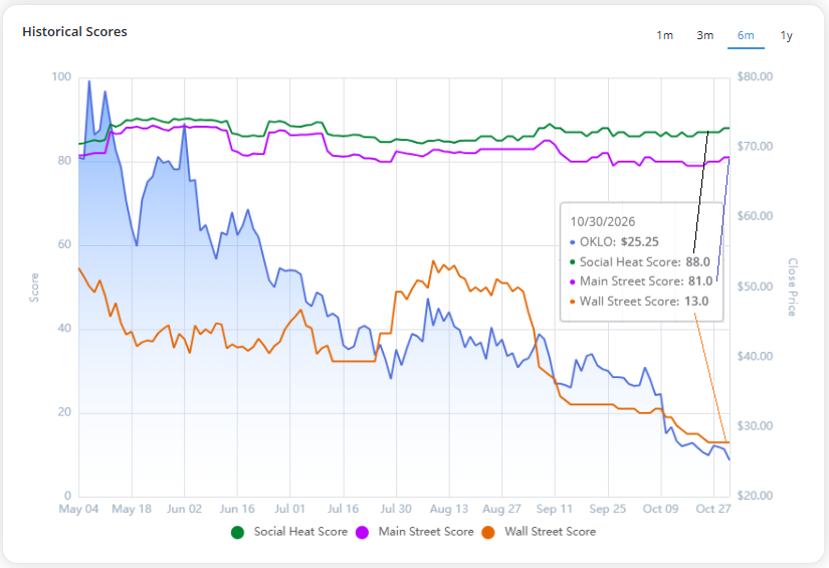
You can see OKLO has held rock-solid Social Heat and Main Street scores for the past six months. But at the same time, the Wall Street crowd has lost interest as OKLO’s share price fell.
In other words, customers in the real world are still as enthusiastic as ever about OKLO, while fickle investors aren’t paying attention and have moved on to new distractions.
All it takes is one strong positive catalyst for the stock’s price to start jumping up again. And if that catalyst comes… the Wall Street crowd is likely to pile back into OKLO and send prices even higher.
Sounds like a great place to start researching new positions, if you ask me!
Mike Burnick’s Bottom Line: Social Heat Scores give you an edge in predicting stocks with rising consumer enthusiasm. And when low Wall Street expectations contrast with high Main Street enthusiasm, these divergences can create opportunities to profit from the stocks in the sweet spot.
Good investing,
Mike Burnick
Senior Analyst, TradeSmith
P.S. The Social Heat Scores – and the Divergences you can find by comparing Main Street and Wall Street Scores– offer powerful insights into consumer spending and enthusiasm that many Wall Street analysts overlook.
In today’s attention-driven market, the Social Heat Scores my colleagues Andy and Landon Swan have developed are an incredibly useful tool, allowing investors to find opportunities well before Wall Street attention sends prices screaming higher.
And as the Swans continue to optimize and enhance their system, they’ve just teamed up with Wall Street legend Marc Chaikin – sharing their latest breakthrough at The Stock Tsunami Event.
By combining the Social Heat Scores and the MegaTrends analytic system with Marc’s proven Power Gauge indicator, the trio has developed a new trading system that allows you to take full advantage of the opportunities presented by Main Street and Wall Street divergences.
The Social Heat Score, based on consumer data, detects Main Street spending momentum, while the Power Gauge focuses on financial strength and Wall Street buying momentum.
Together, these two proven indicators deliver a system that could have turned $1,000 into $8,080. Over the same stretch, the S&P 500 would have turned that same $1,000 into just $2,300.
If you missed the event last week, there’s still time to learn more about this new Social Heat trading strategy. Click here to watch the replay of Marc and the Swans’ event.
Just be sure to act fast: Tonight is your last chance to get access to this powerful new tool.