

Was that loud POP we heard last week the sound of the AI bubble bursting?
That’s the question on Wall Street’s mind after an especially rough week for stocks – and after AI-related tech stocks across the market bore the brunt of a historic post-election selloff.
As the dust settles, investors are desperate to know what’s next for the market.
Thankfully, as one of our TradeSmith Insiders you don’t have to wait around to see how things play out: With our powerful market analysis tools on your side, you can take a closer look and see where markets are standing with just a few clicks.
So, in tonight’s issue, let’s review our TradeSmith Market Outlook data to see where we are after last week’s volatility – and figure out which direction markets are likely to move next.
A Post-Election Check-In With TradeSmith Tools
We’ll start with the indicators on the Markets page. This is where I like to start my mornings before the opening bell each day.
To find them, simply log in to your TradeSmith Finance platform and select Markets from the menu at the top of the screen. By default, this will take you to the Market Outlook page, as shown below:
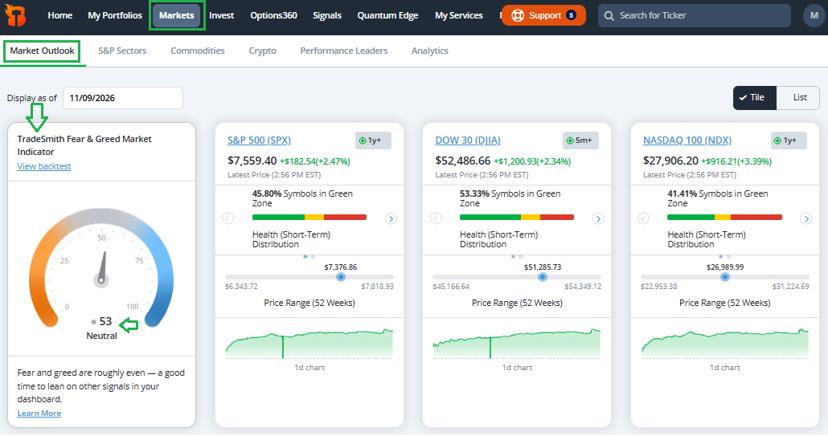
Here you can gauge current market sentiment at a glance, from two angles:
- You can check our TradeSmith Fear & Greed indicators on the left,
- And review the major markets and indexes we track, as shown in their own panels.
After last week’s wipeout – which saw the Dow drop 1,800 points, and saw the Nasdaq 100 lose $1.5 trillion in market value in its largest single-day loss ever – you might think that investors would be intensely fearful.
But that’s not the case.
As you can see above, the current Fear & Greed reading according to our proprietary Indicators is Neutral, at 53.
In fact, only 20% of the stocks we track show “Fear” conditions right now.
TradeSmith’s Fear & Greed Indicator scores every stock we track, rather than just a few index leaders, on three key metrics:
- Price trend in recent months,
- Changes in short term volatility,
- And unusual volume spikes.
The final result of these metrics tells you, with an easy-to-read scale from 0-100, the overall market’s sentiment – not just how the major indexes are feeling.
Historically, a Fear & Greed reading of 53 has corresponded with a rise in stocks over the next 20 trading days 68% of the time, with average gains of 1.2%. That would annualize to a gain of about 12% over a year, which is about average.
While we’re on the Market Outlook page, let’s switch to the List view by using the toggle at the upper right of the page. This lets us focus on the TradeSmith Short-Term (ST) and Long-Term (LT) Health measures for the major stock indexes:
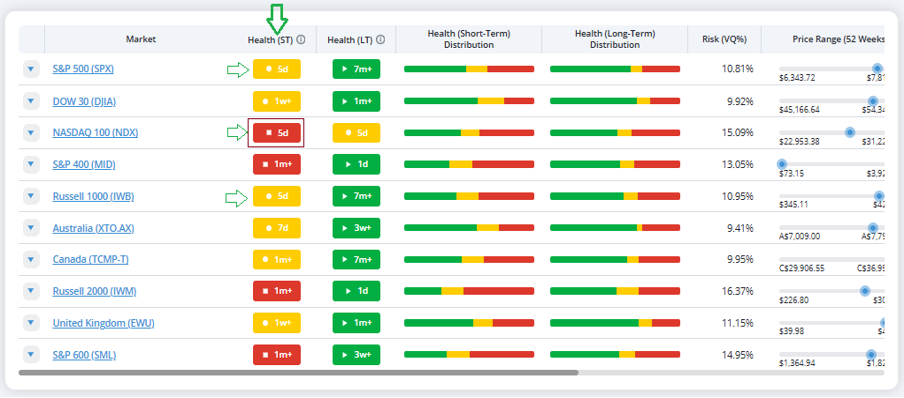
Reviewing the data above, you’ll notice that last week’s selloff did move the needle a bit for several indexes, changing both their ST and LT Health statuses.
The S&P 500 (SPX), Dow 30 (DJIA), and Russell 1000 (IWB) indexes all moved into the ST Health Yellow Zone, which calls for caution. Meanwhile, the tech-heavy Nasdaq 100 (NDX) was hit harder – moving into the ST Health Red Zone. This means that the index has been stopped out, according to our Health indicators.
You can hover your mouse over the colored Health indicator tiles for each index, to see exactly when each Health grade changed. For SPX, IWM, and NDX, the change occurred last Thursday, Nov. 5.
Our ST Health Indicator is highly sensitive to short-term changes in market trends, and each ticker’s ST Health grade is based on price and volatility trends over the last six months. In other words, it’s designed for traders or investors with shorter time horizons, as ST Health signals last about two months on average. However, some ST Health signals can be longer or shorter.
When the ST Health indicator turns Green for a stock or index, we consider it a “flash buy signal” and a point towards bullish positions. Yellow grades are still broadly healthy, but it means the index or stock has declined half-way to our stop level, where the ticker would fall into the ST Health Red Zone.
Naturally, a Red grade is a sell signal. Our research shows that stocks in this category are likely to underperform while in the Red Zone.
So, if you already own a stock that has turned Red, you may want to consider exiting the position.
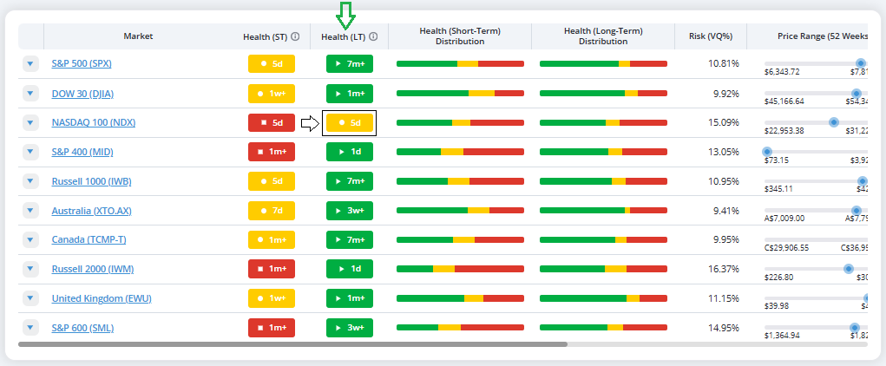
Moving along to the LT Health column, you can see there were also several Health status changes over the longer term.
Currently, all the indexes are looking Green according to our LT Health, except for the Nasdaq (NDX), which turned Yellow last week. Again, yellow is still considered healthy reading, but it is a caution signal:
LT Health is designed for investors with longer time horizons, with each grade being based on price and volatility trends over the last one to three years at minimum.
When this indicator is Green, it means a ticker is seeing normal, healthy trends and volatility. Just like with the ST Health, when the LT Health grade turns Yellow, things are still considered healthy – even though the ticker has declined half-way to the Red Zone.
Likewise, a LT Health Red grade tells you that a given stock or index is unhealthy, with abnormal volatility that should be avoided for the time being.
You can also mouse over the tri-colored bar under each index’s Health Distribution panels to see details on the ST and LT Health Distributions for each index – as seen with the SPX Health Distributions shown below…
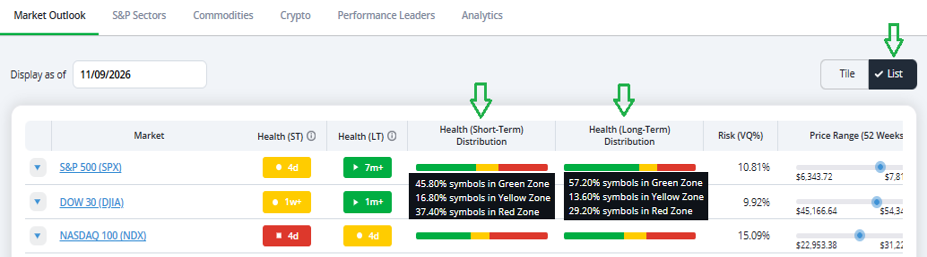
Presently, 45.8% of SPX stocks are in the ST Health Green Zone, with just 37.4% of index stocks in the ST Health Red Zone. And the LT Health Distribution numbers are even better, with 57.2% of SPX stocks in the LT Health Green Zone versus 29.2% in the LT Red Zone.
While the S&P 500 Index did enter the ST Health Yellow Zone –most individual stocks in the index remain in the Green Zone. That’s a positive sign for the market’s short-term direction.
In fact, even as tech stocks have seen weakness in recent weeks, the share of ST Health Green Zone stocks within SPX actually ticked higher to 45.8% today, up from just 24% in mid-October.
This tells me more index stocks are gaining strength than losing it!
On the other hand, the Nasdaq 100 Index has fallen into the ST Health Red Zone. And if you look closer at the distributions, the index now has more stocks in the ST Health Yellow or Red Zone than in the ST Health Green Zone – with just 43.4% of NDX stocks still sitting in the ST Green Zone.
This difference in Health distribution between SPX and NDX provide important clues about the market: The selling is driven mostly by the big technology stocks, continuing a trend that began months ago.
The “Magnificent 7” mega-cap tech stocks peaked during Halloween week… of 2025. And the greater Nasdaq 100 Index topped out in June, made a marginal new high in early October, and has already fallen 15% since, based on last week’s low.
So, the correction in big tech may be dramatic… but it isn’t exactly a hot news story.
Bottom Line: The lack of market-wide fear, plus the ratio of more healthy than unhealthy stocks in the major indexes, are bullish signals that suggest overall market breadth improving, not deteriorating.
This tells me the price action we saw last week looks more like the end stages of a correction than the beginning of one.
I’ll be watching our Market Outlook page closely in the weeks ahead, keeping a close eye on the Health Distributions of the major indexes – and you should too.
A jump in Red Zone stocks could mean markets trading lower in the near term. But if the share of Green Zone stocks increases, as it has been, that could be a signal to buy the dip.
Good investing,
Mike Burnick
Senior Analyst, TradeSmith
P.S. TradeSmith’s Market Health data allow you to think smarter, not harder when managing your portfolio. By digging into the data, we’re able to get a better look at the market’s real status – even as headlines prompt some investors to panic.
That’s one way that TradeSmith’s suite of market analysis and trading tools level the playing field, allowing you to trade like a Wall Street expert.
But there are some trades that even our data couldn’t catch… until now.
Every day, hedge funds and big Wall Street trading firms use options to place massive bets on where stocks will move next – hidden and buried beneath the millions of data points and price updates that make up your average trading day.
These are leveraged bets placed by some of the biggest players in the market: the smart money, the insiders, the major institutional investors. Major market players with connections… and with access to critical information that allows them to make good bets before anyone else can.
That’s just how critical information moves in the market: by the time key information becomes public and you hear about it, it’s often too late to make a profitable trade.
Stocks have already moved… and the big money has already moved their winnings to the next big trade.
It’s frustrating, and it feels deeply unfair.
That’s what drove our team to build a new tool – to uncover the hidden signals left behind by these major options trades and turn them into actionable ideas for traders like you.
We call it Smart Money Edge.
Instead of guessing where a stock is headed next, Smart Money Edge is an AI tool that gives you a chance to see how the Wall Street pros and the really-in-the-knows are placing their bets behind closed doors.
It finds the invisible patterns left behind when these players make their bets, then follows those patterns and crunches the numbers to select the best trades to follow along with that activity – allowing you to trade alongside the Wall Street pros who are quietly putting big money into these leveraged bets.
And based on our research and our extensive backtesting, Smart Money Edge works: This is a system that can deliver big wins and deliver them with consistency. We found that a whopping 80% of the stocks flagged by Smart Money Edge moved higher within a month.
That’s why we released Smart Money Edge to the public earlier this year, to give every investor a chance to make the same profits as the market’s biggest insiders.
Click here to find out more about this AI tool – and how you can start using it today.