

Over three straight weeks of losses, the S&P 500 Index shed 5.7% of its value through the end of last week.
As you can probably imagine, I was good and ready for an adult beverage (or two) when the closing bell rang last Friday afternoon.
Then Monday morning, bright and early as I was prepping for the week ahead over morning coffee, I saw S&P 500 futures plunge more than 200 points, indicating stocks dropping another 4%-plus at the open. Ugh!
Welcome to the first correction of 2024, coming right on cue in early August – one of the more treacherous months of the year for stocks.
In fact, just last year at this time the S&P 500 suffered a 10% correction from August through October. Here we go again. At times like this, it’s more important than ever to exercise discipline with your protective stops, as I’ll demonstrate for you later on.
The good news is that this correction seems to be unfolding faster than last year’s. So, hopefully it will end quicker too.
Plus, it’s important to keep these sudden stock market squalls in perspective. The truth is, corrections like this are perfectly normal.
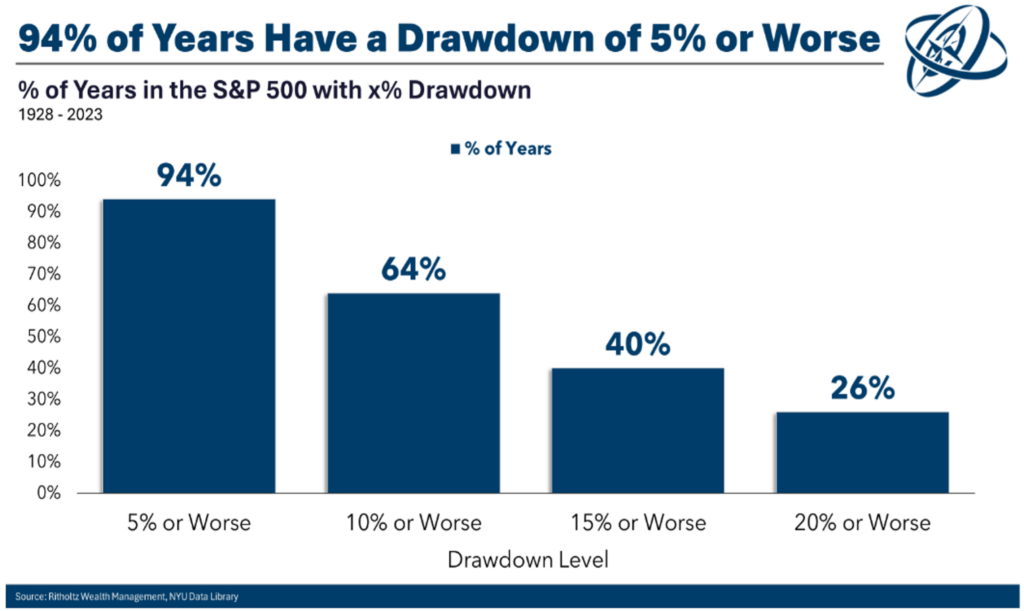
Over the past 95 years, double-digit drawdowns in stocks have happened about 64% of the time, as you can see below. That’s 60 of those 95 years:
Since 1950 the typical stock market correction in any given year is down 13.7% on average. Since 2000, the average correction has been a bit greater, down 16.2%.
So far, the S&P 500 is down just over 8% from its recent high, and the index is still up more than 12% this year.
But it’s still a good time to make sure you have stops in place to help you safeguard your profits and not give it all back in a volatile market drop.
In a recent column I covered our powerful suite of TradeSmith Alert tools, including the alerts in our flagship TradeStops product. Now let’s take a deeper dive into best practices for managing your positions.
As soon as you buy a new stock, the first and most important thing you should do is decide on an exit plan.
TradeStops offers three different stop strategies to help you lock in your profits and avoid losses:
- Trailing Stops, which are based on a fixed-percentage move in the underlying stock.
- Volatility Quotient (VQ) Stops, based on historical price data over the past three years, with recent data more heavily weighted.
- Health Indicator Stops, based on the green-, yellow-, and red-light system that tells you whether a stock is in a healthy state.
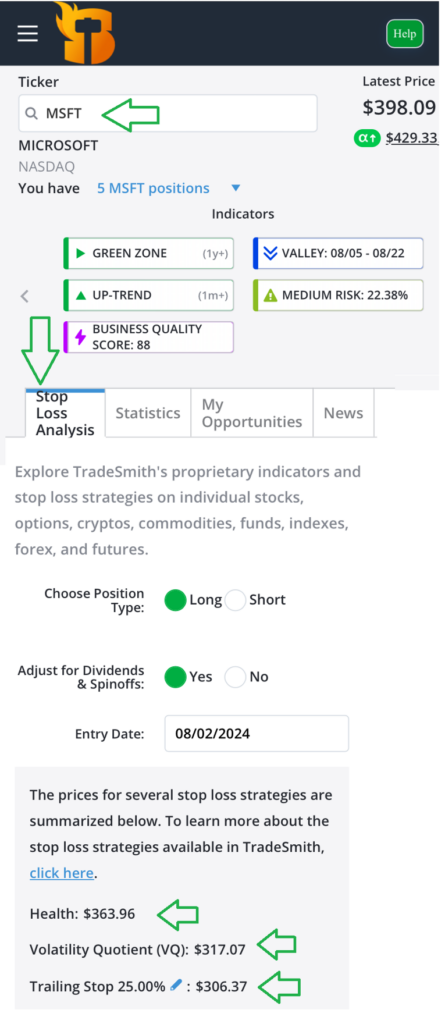
Here’s an example, using Microsoft (MSFT), of how to find and make the most of these stops. First, log in to your TradeSmith Finance platform and type “MSFT” into the Search for Ticker box at top right, then click enter. Or you can click on the stock symbol if it’s one of your existing positions in My Portfolio.
Next, click on the Stop Loss Analysis tab and scroll down, and you’ll find all the current stops listed.
Let’s first take a closer look at our powerful Health Indicator and VQ-based trailing stops.
Then we’ll circle back to traditional trailing stops and see how to use them in combination with our proprietary TradeSmith stops.
Health Stop
The Health Stop represents the life cycle of a stock’s trend. It gives you an easy-to-understand green-, yellow-, and red-light system to determine the health of any stock based on how it’s trending in relation to our proprietary Volatility Quotient.
Just like a person’s fingerprints, each stock has its own unique Health Trend. The calculations are a bit complex, but the concept is simple: Find the trend – the basis of our Smart Moving Average – that best supports the long-term price movement.
As you can see above, MSFT remains in the Health Indicator Green Zone with our example price of $398.09. But if it enters the Red Zone, falling below $363.96 (roughly $34 lower), it means the stock’s trend has turned unhealthy based on historical data.
When using the Health Indicator as a stop-loss strategy, this is your exit point.
Volatility Quotient (VQ) Stop
The Volatility Quotient is our proprietary risk metric for any security we track. It’s based on historical price data and is continuously updated for you. We use three years of price data, with the past year more heavily weighted.
Our algorithms calculate the expected move of a stock or any asset to determine the typical range, or amount of room you can give the stock to fluctuate normally.
The VQ is dynamic and updated weekly to ensure you take the right risk in any trade. When it comes to VQ, lower is better, which means lower risk. Here’s the VQ range we use.
- 15% or less: Low risk
- 15% to 30%: Medium risk
- 30% to 50%: High risk
- Above 50%: Sky-high risk
The VQ stop is typically less conservative than the Health Stop – it gives you more “room” for the stock to fluctuate, because it triggers at a lower price – but not always. It depends on the underlying volatility of the stock compared to its normal volatility.
For MSFT, the VQ stop is currently $317.07, or about $81 below the current price. So, if you’d like to give the position more breathing room, you could choose the VQ Stop instead of the Health Stop for MSFT.
Trailing Stop
The beauty of trailing stops is that they move, or trail, the stock price in real time. They’re designed to lock in profits and limit losses based on your entry price.
For example, if MSFT rises in price, the trailing stop will rise along with it to lock in more gains. It’s based on a defined percentage away from the stock’s current price.
For long positions, the stop would be below the current market price.
For short positions, it would be above the current market price.
Our system defaults to a 25% trailing stop, currently $306.37 for MSFT shares. But you could set the trailing stop at any percentage below the market price, making it totally customizable.
So, you could set your trailing stop tighter, at 10%, or further away, at 30% or more.
In practice, you may want to use a trailing stop that’s set at a tighter or higher level below the current price.
Keep the percent stop wider at the beginning to give a new stock position more room to fluctuate. But then tighten the percentage of your trailing stop as time goes on and your profits build.
Here’s a good rule of thumb I learned many years ago from a trusted mentor of mine in this business.
- After earning a profit of 10%, set a stop so you don’t give back more than two-thirds (66%) of your open gains.
- After a 20%-to-30% profit, use a trailing stop that locks in at least half your profit (50%).
- And after a 50% or more gain, give up no more than one-third (33%) of your profit.
Then the other two types of stops – VQ or Health – would come into play to let you know if your position falls all the way to the danger zone.
This method isn’t perfect, but it’s easy to adjust and apply to any stock in your portfolio. Plus, it can greatly reduce your stress level, especially in a volatile market correction like this one.
Mike Burnick’s Bottom Line: Because it’s such an important cardinal rule of investing, I’ll say it again. As soon as you buy a stock, the first and most important thing to do is decide on an exit strategy and set a stop. You should take full advantage of our TradeSmith stops and Alerts tools to set hard-and-fast stops for each position. And remember, stock market corrections, just like summer thunderstorms, usually pass quickly.
Good investing,
Mike Burnick
Senior Analyst, TradeSmith