

Persistently low readings on the CBOE Volatility Index (VIX), despite the market’s recent swings, have got some folks asking me if the stock market’s “fear gauge” is broken.
My response is: yes and no.
April’s brief market swoon saw the VIX briefly jump just above 20. Since then, the fear gauge quickly sank back to the 12-to-13 range where it’s been stuck most of this year.
That begs the question, shouldn’t the VIX be acting more … fearful these days?
One possible explanation is that the VIX measure of volatility may not be as relevant as it used to be. The VIX just celebrated its 30th birthday last year and bases its reading on the premiums of S&P 500 calls and puts, both weekly and monthly expirations. But these past few years, new and very short-term options have been introduced – and widely adopted.
Below you can see how popular the zero-days-to-expiration (0DTE) options have become:
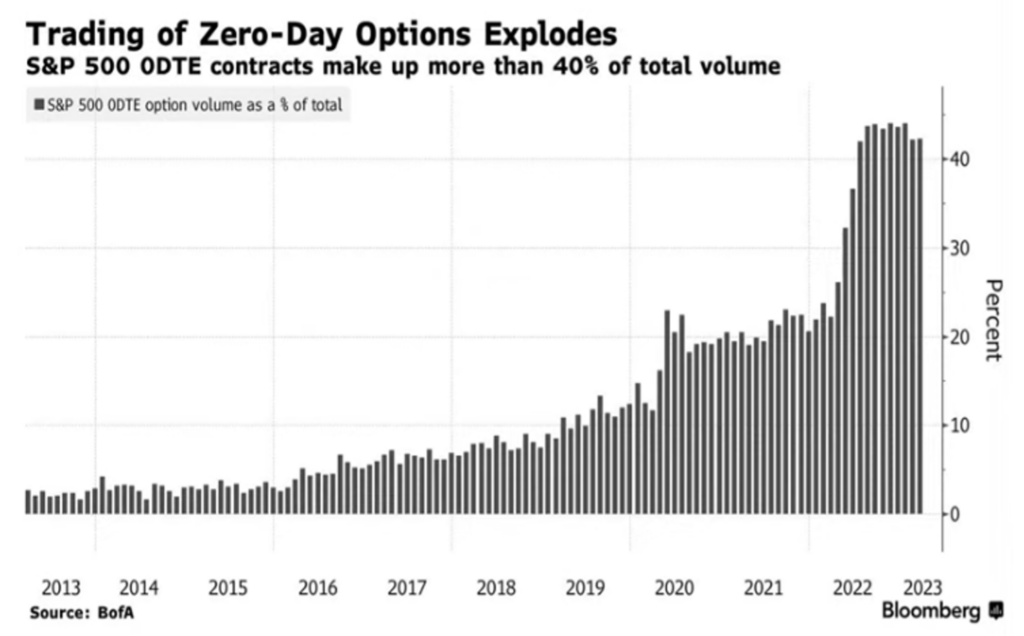
As Jonathan Rose of TradeSmith’s corporate partner Masters in Trading points out, hedge funds and other short-term traders are often using 0DTE option contracts instead of the usual expirations that the VIX relies upon. So the VIX may no longer accurately reflect the urgency of investors to hedge against a potential market decline.
Investors today simply have more … options, if you’ll pardon the pun.
To be fair, the VIX might not be that far off. If you’ve checked on day-to-day market swings recently, you’ll find that the variance of daily S&P 500 returns this year is pretty low, at just 0.7%, compared with its average of about 1% daily swings (up or down) since 2010.
While that might not sound like much of a difference, it adds up to 30% less day-to-day stock market turbulence than usual, which could explain low VIX readings.
But the truth is, VIX is more of a coincident indicator than a leading indicator, anyway. In other words, by the time you see VIX spike higher, stocks are most likely already declining.
A Better Way to Gauge Volatility
For my money, the TradeSmith Market Outlook page gives you more reliable indicators, namely our version of the stock market Fear & Greed indicator.
Simply log into your TradeSmith Finance platform and click on Markets along the top menu, then Market Outlook, and you’ll find our Fear & Greed indicator at the top-left.
As you can see below, the Fear & Greed indicator is still in Greed territory. That’s down from a reading of Extreme Greed just weeks ago during the April market swoon:
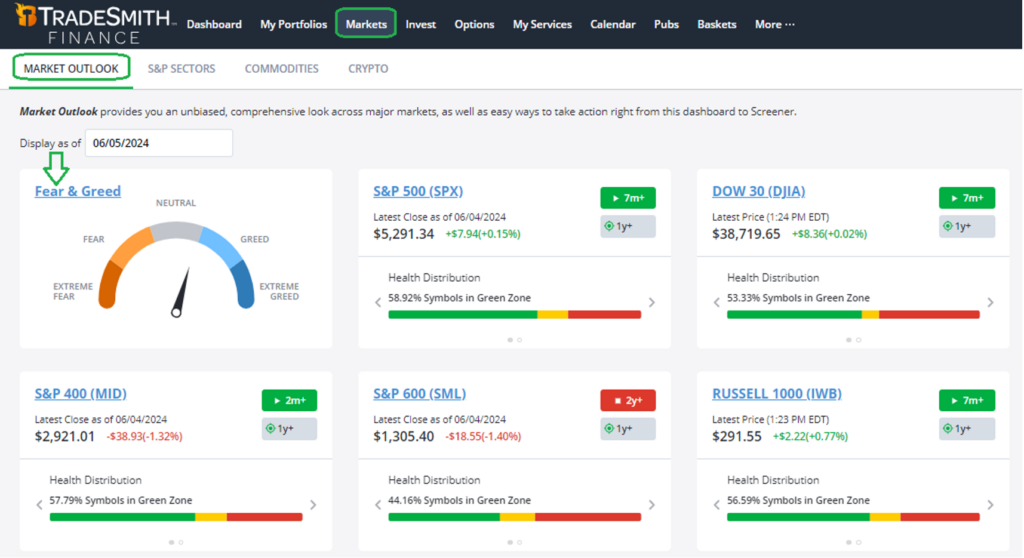
This indicator is a blend of seven different components that can lead to market instability, one of which is the VIX. The other six include:
- Junk Bond Demand, measured by the popularity of lower-quality, high-yield bonds
- Market Momentum, measured by how far the S&P 500 has gotten above or below its 125-day moving average
- Safe Haven Demand for U.S. Treasury bonds
- Stock Price Breadth, measured by the difference in volume between advancers and decliners
- Stock Price Strength, or how many stocks are making new one-year highs vs. one-year lows
- Put and Call Options Volume, measured by volume of bearish put options versus bullish call options
Let’s take a closer look at two factors that are signaling a negative divergence with the rising stock market.
Red Flags for the Health of This Rally
The chart below shows two key breadth measures for the S&P 500. At the top is the percentage of S&P stocks making new highs vs. new lows. Then at the bottom is the percentage of S&P stocks trading above their key 50-day moving average:
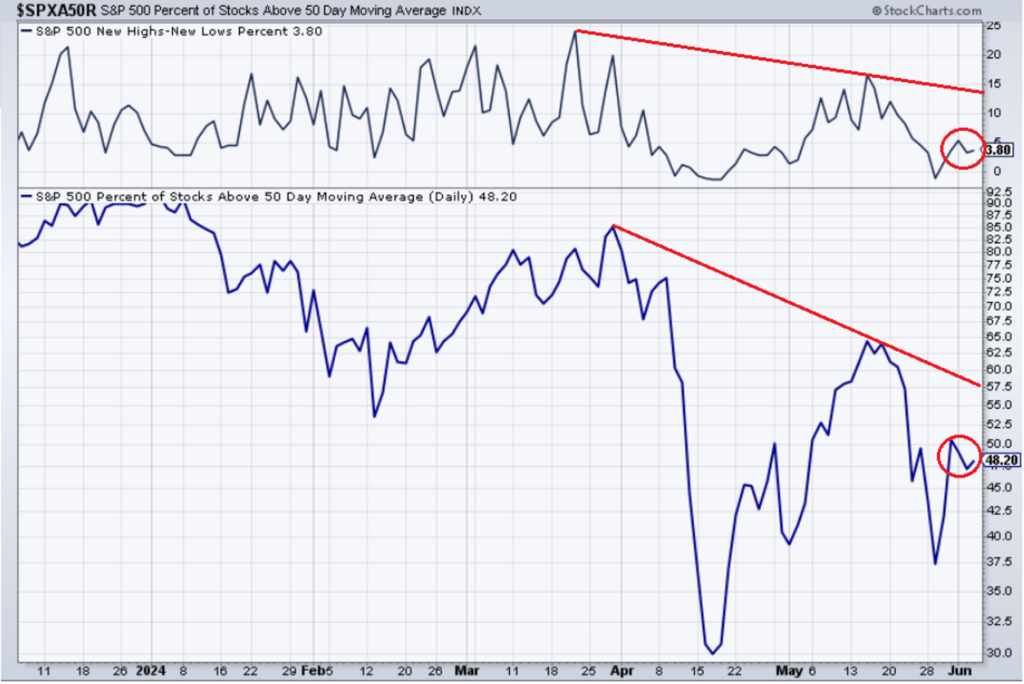
Notice that since the April market peak, the percentage of new highs to lows declined sharply, and so did the percentage of stocks above their moving average. That’s what you would expect during a market pullback.
Recently the S&P 500 has rallied back to new all-time highs. Yet, fewer stocks are making new highs and fewer are breaking out above their 50-day averages. So, that’s a bit of a red flag to keep an eye on.
Our TradeSmith internal breadth indicators for the S&P 500 pick up on this same trend but show a much more subtle shift.
The percentage of S&P 500 stocks we’re tracking in the TradeSmith Green Zone declined from about 67% at the beginning of April to 58.9% today, while the number of Yellow Zone stocks expanded:
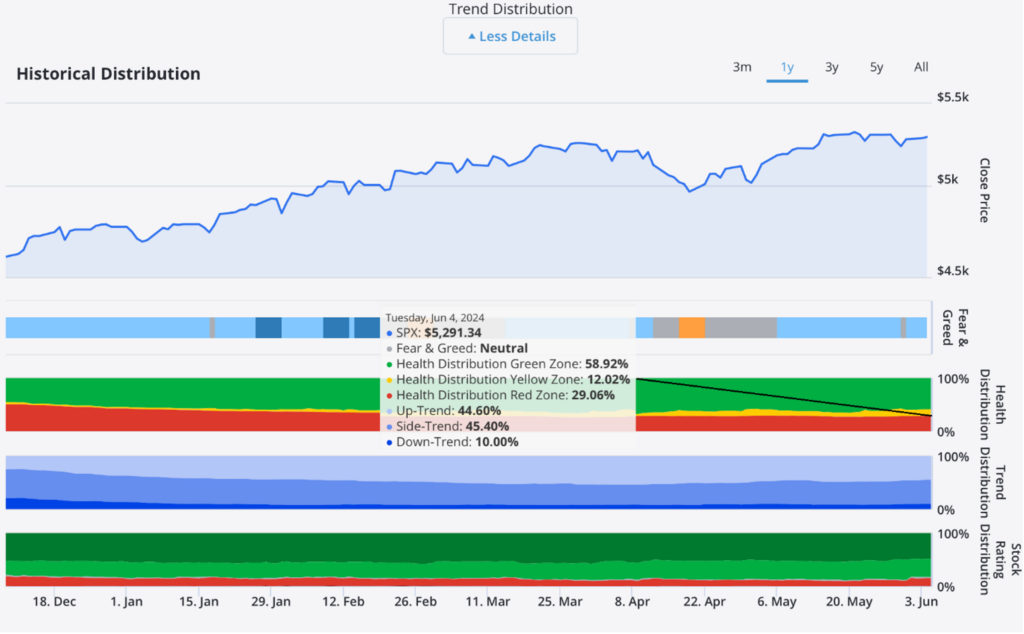
Likewise, the percentage of stocks in confirmed uptrends (according to our Smart Moving Average) has fallen from 53.7% in April to 44.6% now. Still, it’s clear the majority of S&P 500 stocks remain healthy in the Green Zone, and that’s good news for the stock market.
Mike Burnick’s Bottom Line: The VIX fear gauge may not work as well as it once did due to the popularity of new, short-term options, but our TradeSmith Market Outlook, including our own Fear & Greed indicator and historical health, trend, and stock-rating distribution can keep you well-informed on a daily basis. While there’s been a subtle downward shift, the state of the market is still strong.
Good investing,
Mike Burnick
Senior Analyst, TradeSmith
P.S. Next week is Apple’s first big event of the year, the Worldwide Developer Conference, which is sure to shine a bright spotlight on Cupertino, California…
But according to Luke Lango, a senior analyst at our corporate partner InvestorPlace, the media is missing the most important part of Apple’s story right now.
And that’s the fact that one tiny AI company with more than 20 patents holds the key to Apple’s AI takeover.
Luke will be briefing you tomorrow, June 7, at 1 p.m. Eastern, just about 72 hours before we get what could be a historic AI announcement from Apple.
That’s when you can hear the details on the small-cap AI stock that Luke thinks could double your money in a matter of days, and even 10x your money in the coming months. Click here to automatically save your seat now.