

Mike Burnick here.
The supposed Chinese proverb “may you live in interesting times,” is actually a curse – meaning that interesting times are often chaotic times of trouble.
That’s why I’ve got my eye on two key market indicators right now: the CBOE SKEW index and the Equity Euphoria Indicator (both pictured below).
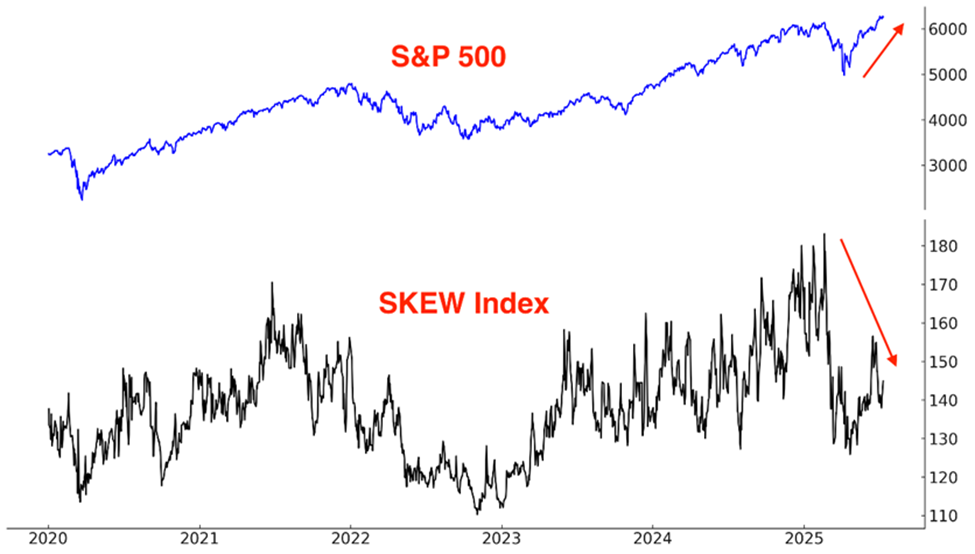
The SKEW Index acts similarly to the VIX as a measure of potential risk in the stock market. More specifically, the SKEW reflects the potential tail risk in the options market – in other words, the risk of a sudden extreme move to the downside.
And as you can see from the sharp decline shown above, nobody seems to expect a sharp drop in stocks… which is precisely when you should worry about one unfolding.
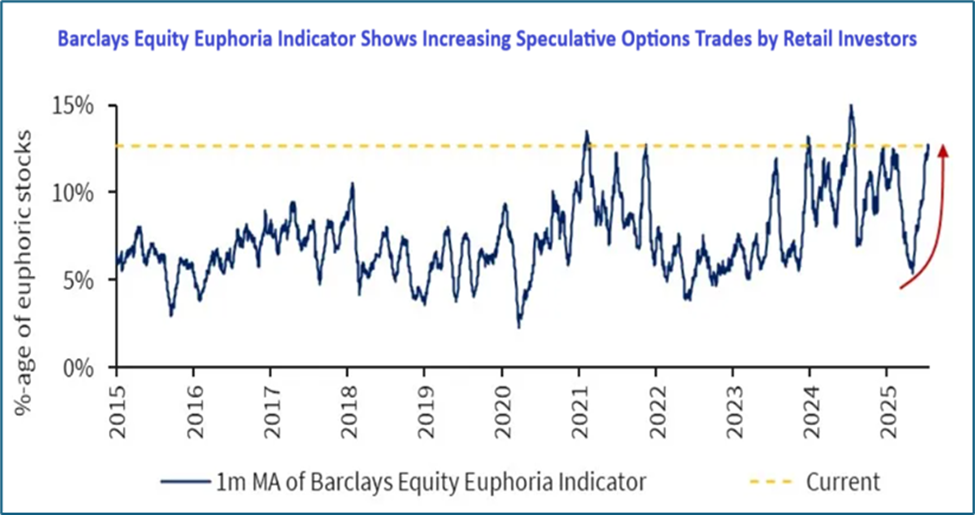
Meanwhile, the Equity Euphoria Indicator just hit its highest level since late last year, according to Barclays, which maintains the index.
It points to the growing, speculative frenzy in stocks today… which means volatility could soon be on the rise.
So, if risk is relatively low – and we can see that as the CBOE Volatility Index (VIX) continues to march lower as the days go by – and euphoria is high…
Shouldn’t that be a good thing for investors?
My answer is no. And in fact, it’s high time to start bracing yourself – because a storm could be coming soon.
This situation is so serious that even our CEO at TradeSmith, Keith Kaplan, has it on his radar.
Last week, Keith went live with a critical broadcast that details how the market could be in for a serious turn – but it’s all not bad news.
I’ll let him step in here to explain it all…
Hidden Patterns in the Market
Keith Kaplan here.
As TradeSmith CEO, I run a team of top “quant” investors, data scientists, and computer programmers.
And for the past three years, we’ve been developing software that can spot hidden seasonality patterns in the stock market.
The basic idea is that certain price trends repeat year after year, regardless – not unlike the nature’s seasons.
Stocks don’t have summers and winters exactly. But we’ve been able to identify consistent, repeating cycles in stocks, currencies, and even commodities like oil and soybeans.
They’re occurring all the time, all through the year.
These patterns are hard for humans to see. But our software reviews decades of market history for thousands of stocks, indexes, and commodities—to pinpoint the moments when prices tend to turn, down to the calendar day.
And right now, it’s flagging a major regime change for the stock market – beginning tomorrow, July 30.
Not a crash – I’m NOT recommending you pull out of the market entirely. But a change in market trend that could catch millions of investors unaware.
That’s why last week, I hosted an online briefing along with legendary quant investor Louis Navellier to get the word out to as many people as possible.
You see, the SPDR S&P 500 ETF (SPY) has just exited one of its green seasonal windows when the index has historically risen, year after year.
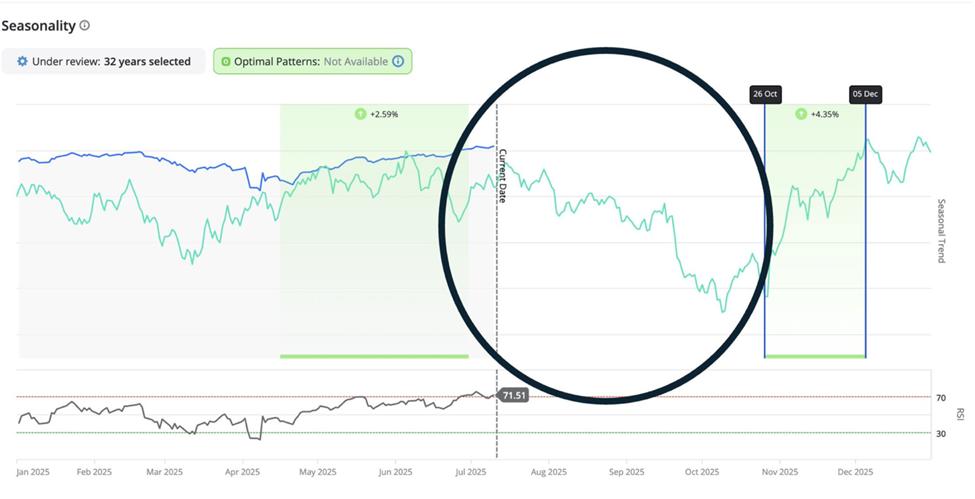
The bullish window that just closed has delivered gains over 80% of the time, based on market data from the last three decades.
And sure enough, since the “green day” on June 28, the S&P 500 has reached new all-time highs. It’s now up more than 30% from the April low, as I mentioned earlier.
But see how the market has tended to stumble in the circled area above after that green seasonal window ends? We have gotten a top around July 28. Then the market has stumbled before bottoming out in October.
Over the past 15 years, the S&P 500 has had an average return of -1.6%, falling as much as 15% during this window.
That doesn’t mean we should sit on our hands for the next three months. Instead, we need to act quickly with our trades – and be open to alternatives.
We don’t stop trading. We just have to trade smarter.
Time to Follow the Goldbugs
In times of sinking stocks, our Seasonality tool shows that gold tends to rise. This makes it a go-to trade during the late summer stock market slump.
Here’s what our Seasonality tool forecasts for gold in the coming months. Gold has two green days coming up, back-to-back – starting right as the S&P 500 enters its bearish pivot point:
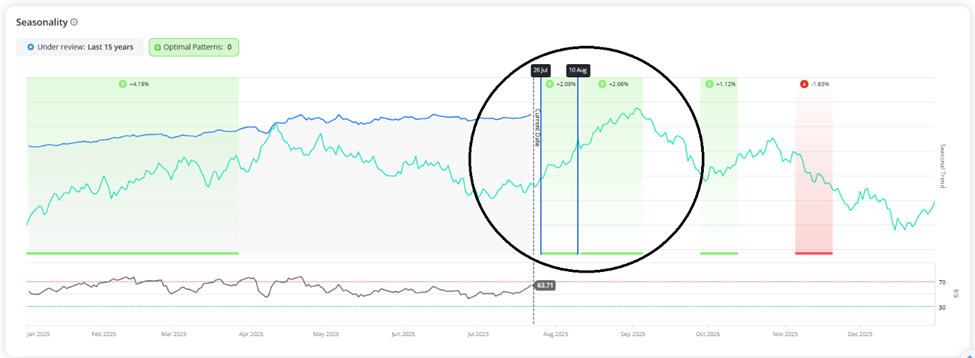
Over the last 15 years, gold prices have risen 80% of the time or more during these windows for an average return of 3.2% across both.
If you could repeat that trade every six weeks, you’d have an annualized gain of roughly 33%. And that’s assuming you only saw the average return. Often, gold gains even more.
For instance, in 2020, gold rose 6.4% in just the first 15-day window.
And in 2011, it gained 10.6% during this window. It then went on to rise another7.3% after its second “green day.”
Historically, this seasonal bullish period lines up neatly with buying patterns in India – the world’s top consumer of gold as of last year. It’s an ideal time for gold retailers to stock up ahead of the wedding and festival season there, which kicks off in October.
A New “Rapid Fire” Trading Approach
This is just one example of the profit opportunities our Seasonality tool has uncovered.
There are plenty more, hidden beneath the surface—in commodities, currencies, crypto, and stocks.
That’s why I’m giving Inside TradeSmith readers access to our seasonality charts to see what cycles are hiding in your favorite stocks. It’s already helping TradeSmith members prepare for pullbacks the market may throw at us in the coming weeks.
We’ve found stocks that follow their seasonal trends so consistently that you could’ve traded them for three decades straight and ended up with an 83% success rate.
And by leveraging the power of this tool through options, our subscribers have been able to close out the following gains in our model portfolio…
- 107% on Aon (AON) calls in 23 days
- 112% on Hasbro (HAS) calls in 10 days
- 124% on Booking Holdings (BKNG) calls in 15 days
- 180% on Analog Devices (ADI) calls in 14 days
- 248% on Intuit (INTU) calls in 15 days
Just remember that the market shift our Seasonality tool sees coming could hit as soon as tomorrow.
So, act quickly – go here now.
All the best,

Keith Kaplan
CEO, TradeSmith