

Along with Monoploy and Risk, one of my favorite board games to play as a kid was Concentration.
All three of these games provided endless entertainment on rainy days when I couldn’t be outdoors getting into trouble.
And I believe that all three games helped put me on a path for a successful investing career.
Concentration, in particular, helped me improve my pattern recognition skills, which paid off years later when I was reading and recalling stock charts.
Right now, the stock market is playing a massive game of Concentration, where the top stocks by market cap have a huge influence on the market overall.
But is that a good or bad thing? The truth is, it can be both.
The S&P Turns Top-Heavy
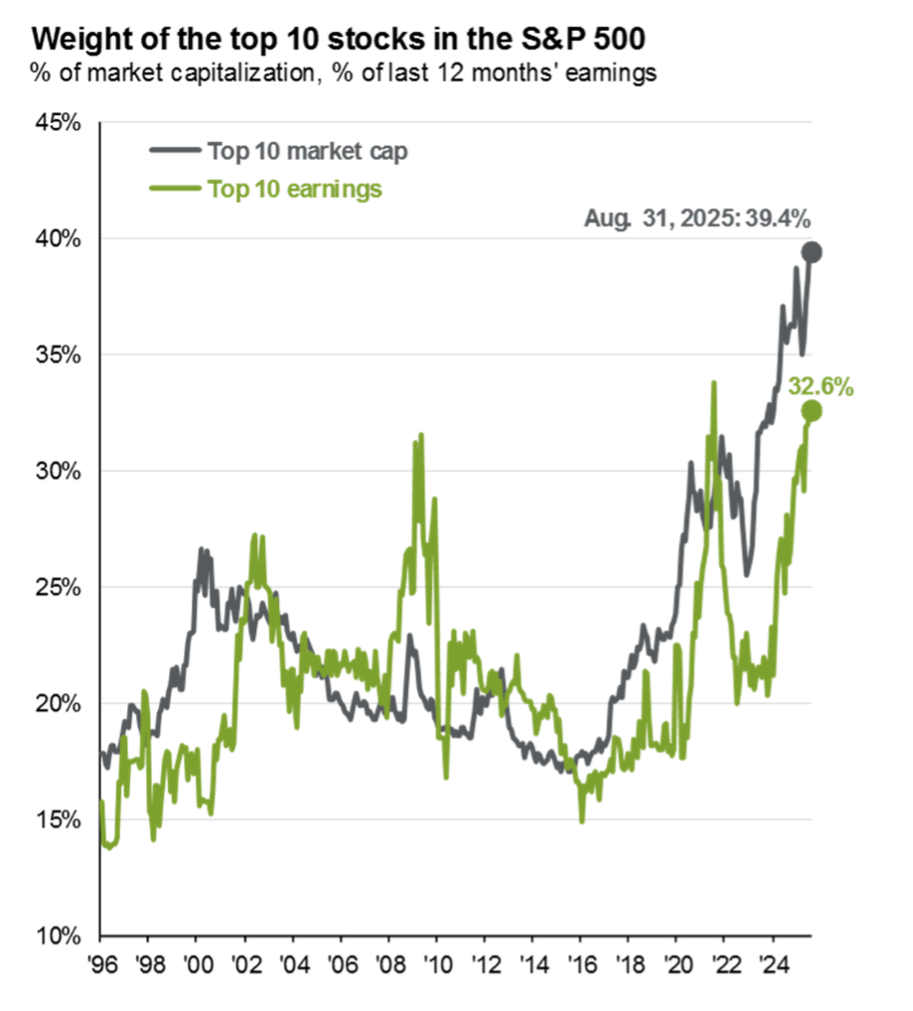
Currently, the 10 largest stocks in the S&P 500 account for nearly 40% of the index’s total market capitalization, as you can see above.
This level of concentration is even more than just before the dot.com bust in 2000 – an example of “bad” concentration. In fact, the S&P hasn’t been this top-heavy since the Nifty Fifty days of the early 1970s, which also ended badly.
The difference this time comes down to is valuation and profits.
In 2000, as is the case again now, the top 10 were mostly technology and telecom stocks. But back then, the top stocks traded at a Price-Earnings (P/E) ratio of more than 40X earnings.
Today, the valuation of the top 10 is about 29X earnings. And those earnings are growing at a fast pace, accounting for about one-third of all S&P 500 index profits, as also shown above.
Plus, the top 10 stocks in the index have something the rest of the S&P doesn’t… superior earnings growth.
Since the start of 2023, profits for the top 10 S&P 500 stocks have surged 122% higher. The rest of the S&P companies grew earnings by just 7% growth over that same period.
So, the market’s top stocks have earned their way into the winner’s circle.
Still, the stock market rally is showing signs of broadening out. The “S&P 493” are beginning to catch up to the Magnificent 7 in terms of expected profit growth.
That could mean a change of leadership may be at hand. In fact, changes to the economic cycle are often a catalyst for just such a leadership change to take place.
And we have the mother-of-all-catalysts coming up: The Federal Reserve is widely expected to start cutting interest rates at next week’s policy meeting.
Big monetary policy shifts like this often led to changes of stock market leadership. For instance, cyclical and financial stocks are often among the top performers as interest rates decline.
And one of the best ways to spot changes in market leadership is to simply follow the money.
After all, the “smart money” starts moving long before you hear about it on CNBC. And to help you get an early jump on these opportunities, TradeSmith Money Movers can be an invaluable tool.
Inside the Money Movers Tool
We analyze several smart money signals to identify which assets are starting to get pushed up – and which are starting to get pushed down.
To access the Money Movers page on TradeSmith Finance simply click on the Invest tab from the main menu, then select Money Movers in the sub-menu tab:
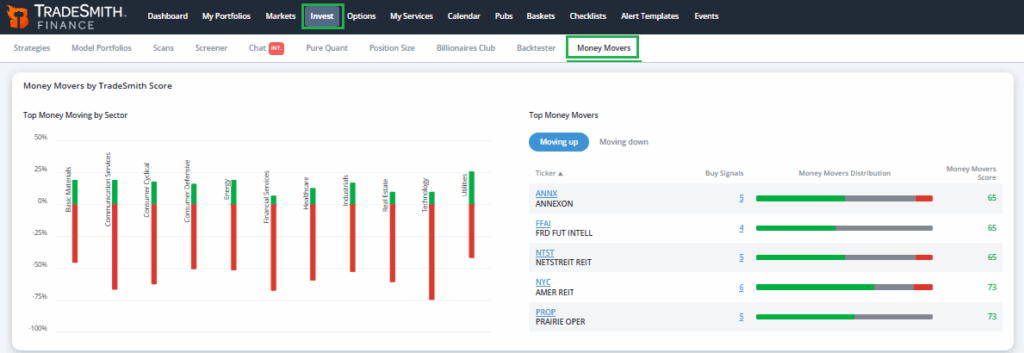
The Money Movers tab shows you which sectors and stocks the big money institutional traders, investment banks, and billionaires are moving into and out of.
There are tons of valuable data for you to mine on this page to help you make better and more informed investment decisions. So, let me walk you through it…
Top Money Moving by Sector
At top left, we highlight the sectors with the most big-money movement, either in or out.
The green & red bars tell you at a glance which sectors have the most money moving in or out. Right now, the Utility sector currently shows 26% of money moving in, but -42% moving out.
Scanning through the different sector activity in Money Movers gives you a quick reading on big investors’ movements for the stock market as a whole.
Top Money Movers
At top right, we display the biggest movers in the market for individual stocks. You can sort top Money Movers by those moving up or down.
Here’s how you should interpret the Money Movers Score:
- Scores range from 0 to 100 → Closer to 100 = Strong buy signal
- Scores range from 0 to -100 → Closer to -100 = Strong sell signal
Individual Signals
Scroll down the page, and the next section highlights the top Money Movers by individual stocks, broken into tabs, as you can see below:
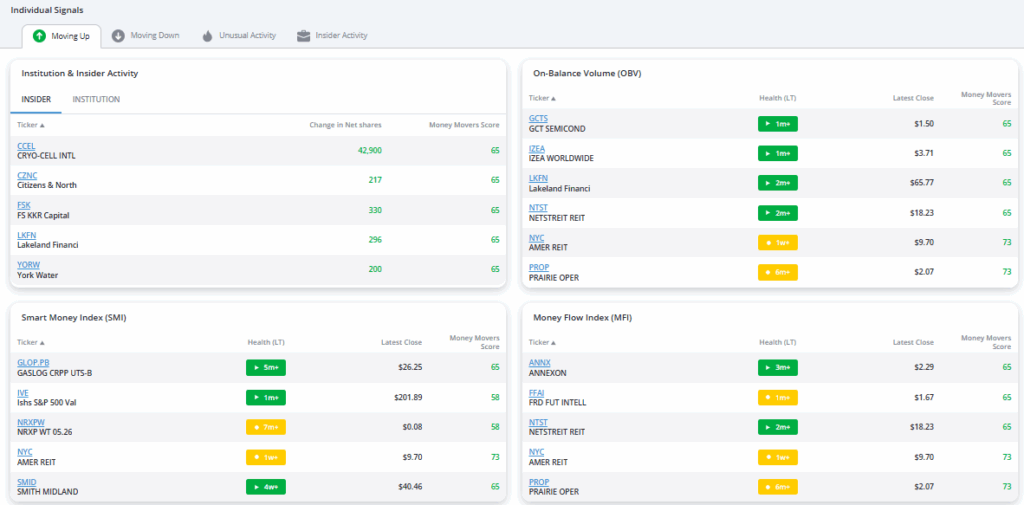
- Moving Up: Stocks with positive and rising Money Movers scores
- Moving Down: Stocks with negative and falling Money Movers scores.
This section also breaks down our Money Movers data into individual components that make up our score, which are…
Institution & Insider Activity
- Insider Section – Tracks buying activity from company officers, directors, and those with inside information.
- Institution Section – Monitors TradeSmith Billionaires Club holdings, identifying stocks Moving Up (new buys) or Moving Down (fully sold off).
On Balance Volume (OBV)
This popular momentum indicator measures positive and negative volume flow to anticipate where the big money is shifting its asset allocation.
Smart Money Index (SMI)
Another widely followed money flow indicator that measures investor sentiment based on intra-day price patterns, indicating smart money flow.
Money Flow Index (MFI)
This technical oscillator detects overbought (>80, sell signal) or oversold (<20, buy signal) conditions, helping identify key changes in trend.
The last two tabs in this section provide you with more valuable Money Movers data, as shown below:
Unusual Activity
This tab highlights unusual trading activity in stock options, which can often be a tip-off for a big move in the underlying stock.
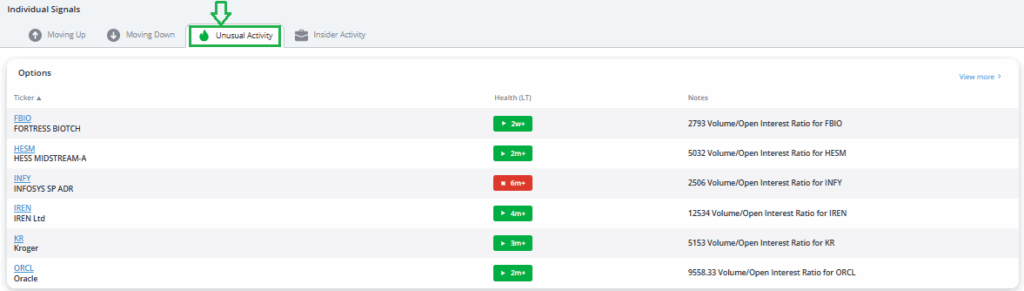
For options traders, we show you the volume-to-open interest ratio for the underlying stocks. High volume trades relative to the open interest can flag unusually large option trades.
Insider Activity
This gives you a rundown of which stocks have buying or selling activity by management, directors, and other key insiders.
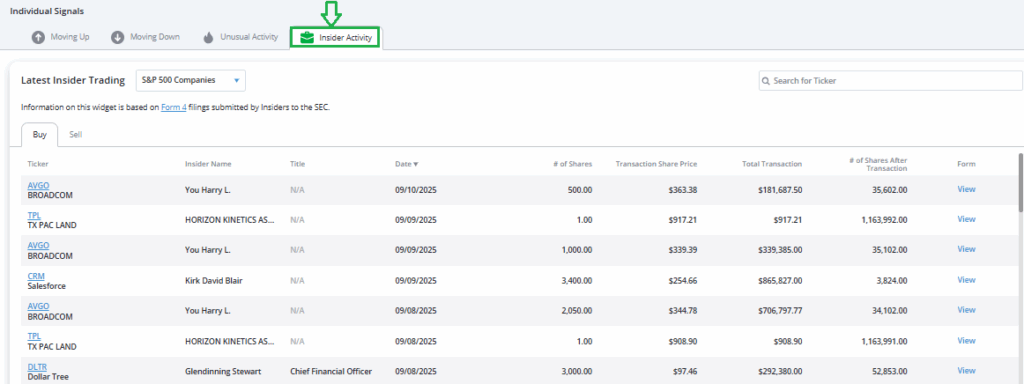
For corporate insiders, our data shows you the number of shares bought or sold, as well as the trade price, total value of the transaction, and the total amount of shares owned by the insider. You can also click on View, highlighted at far right, to see the actual SEC filing.
Mike Burnick’s Bottom Line: When the stock market undergoes leadership changes it often shows up first in our exclusive Money Movers scores. That’s where you can spot early shifts in price and volume going into or out of certain stocks and sectors. These moves are typically the fingerprints of insiders or big institutional investors making important changes to their investments – and by tracking them, you can piggyback on the strategies of the market’s most powerful players.
Good investing,
Mike Burnick
Senior Analyst, TradeSmith
P.S. The stock market may be concentrated at the top, but history shows that leadership eventually shifts – often faster than most traders expect. And when it does, the biggest opportunities often come from uncovering the next wave of winners before the rest of the market catches on.
That’s exactly what my colleague Eric Fry has been focused on. While Money Movers helps you follow where institutional capital is flowing today, Eric’s breakthrough system is designed to identify opportunities of tomorrow. Over his career, he’s delivered 41 recommendations that each soared 1,000% or more.
And yesterday, Eric unveiled what he’s calling “Nvidia on Steroids” – a tiny AI stock he believes could be the breakout story of 2026. This new Apogee stock-picking model, built on decades of experience and 5.2 million back-tests, zeroed in on this under-the-radar company just as it struck a deal with the world’s largest retailer.
If you missed Eric’s 10X Breakthrough event, don’t worry. You can still catch the replay and see the full recommendation – and the ticker – while its available.