

It’s been a brutal month and some change for Wall Street: The stock market has fallen for five straight weeks now – and it’s been one of the swiftest corrections in recent memory, with both the Nasdaq 100 and the S&P 500 Indexes falling 10% or more as of last week.
The question now is: Will stocks bounce back? And if they do… what stocks have the best potential for gains after the swift drop?
We’ll have to wait and see to answer that first question. But to help you answer the question of which stocks to look out for, we can simply consult TradeSmith’s proprietary artificial intelligence-powered algorithm –Predictive Alpha.
More on the Predictive Alpha system in just a moment.
But first, what are the odds the stock market bounces back quickly from this selloff?
Well, while past performance is no guarantee of future results, it’s sure nice to know that 70 years of market history say that stocks are most likely to keep moving higher from here!
Since 1950, the S&P 500 has experienced 28 technical corrections (that’s a drop of 10% or more from the most recent high) with the current number of 29 arriving last week.
And as you can see below, we shouldn’t be too scared right now – Correction 29 is in line with the recent norms. Since 1928, the average S&P 500 correction brings a drawdown of -14%… and the index sees roughly one correction of this intensity each year:
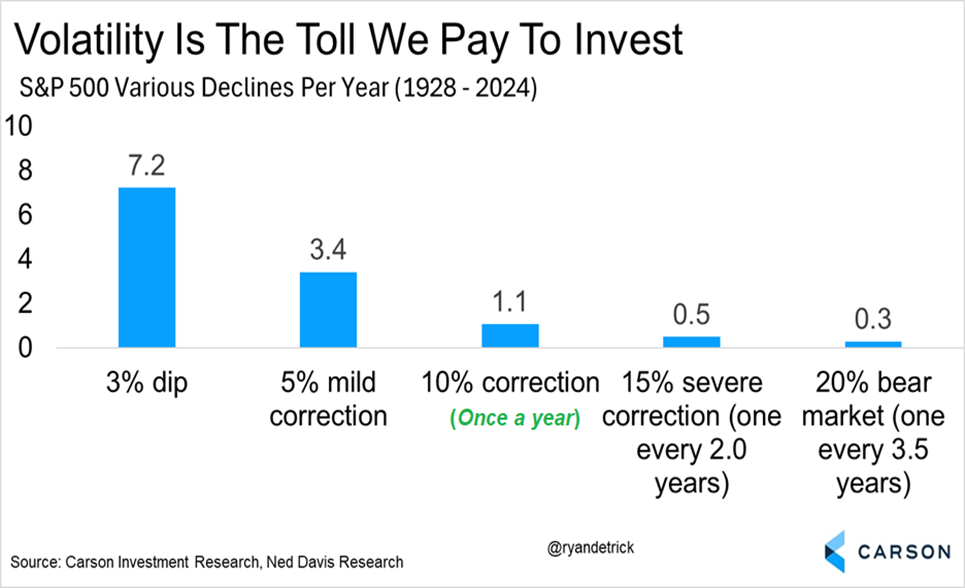
And notably, only 11 of these market pullbacks morphed into full-blown bear markets (with average drawdowns of -36%).
In other words? Over 60% of the time, stocks bounce back without getting mauled by the bear.
In fact, in most years where the market fell at least 10% at some point, stocks still tended to end the year higher, with an average full-year gain of 9.5% in those instances.
That’s good news, albeit for the long run… but what about the here and now?
Well, historically, we can expect short-term returns for stocks to be a mixed bag over the next few weeks or so.
But the swiftness of this correction, assuming it’s only a temporary pullback, should also be mirrored by an equally swift recovery, according to the historical record.
Of all the times where the S&P 500 declined 10% or more but did not fall into a bear market (marked by a drop of -20% or more from recent highs), stocks typically regained their footing quickly – they bounced right back.
In fact, the greatest loss seen by the S&P 500 in the month followinga-10% correction was just -1.7%. That’s paltry, compared to the index’s average results following that type of moderate correction: The S&P usually bounces back substantially, up an average of 7.1% one month later.
And I can add to that good news, too: Historically, the S&P’s minimum post-correction gain in these scenarios was only slightly below the average – with a rise of 5.1%.
The lesson here is that if this is only a brief stock market correction, then history says stocks should get right back on track to the upside – within a matter of weeks. Let’s hope that history is on our side.
A TradeSmith System to Take Advantage of a Market Rebound
The S&P’s history of post-correction rebounds is comforting, but the history books aren’t quite as useful when it comes to finding the best opportunities in the wake of today’s correction.
For that problem, we can instead turn to one of TradeSmith’s most impressive market-scanning systems… one that our team of analysts and software developers spent many years (and millions of dollars) developing: a powerful proprietary algorithm that can project short-term stock moves, backed by the power of artificial intelligence.
We call it Predictive Alpha.
ThePredictive Alpha system works by first considering a variety of starting inputs, including economic data like interest rates and inflation; fundamental data like profits and valuation ratios; and technical insights like relative price strength and moving averages.
Then, our AI-powered algorithm crunches all these numbers against data on nearly 1,900 securities (mostly stocks, plus a few dozen major ETFs). And in a split-second, our algorithm ranks each security in its database based on two key predictive metrics:
- The direction a security is expected to move over the next 21 trading days (up, down, or flat)…
- And the magnitude, or the percentage change it’s projected to make in that time.
In this way, Predictive Alpha can show you, at a glance, where any stock is projected to go over the next month or so, and it gives you an estimated price projection – right down to the penny.
With that in mind, I thought now would be a good time to put Predictive Alpha’s computing power to work to find us some new stock ideas, now that we’re in correction territory.
By running the screener below, we can get an instant – and objective – look at which stocks may be best positioned to keep moving higher from here.
Screen for Stocks Likely to Bounce Back in the Next 21 Days!
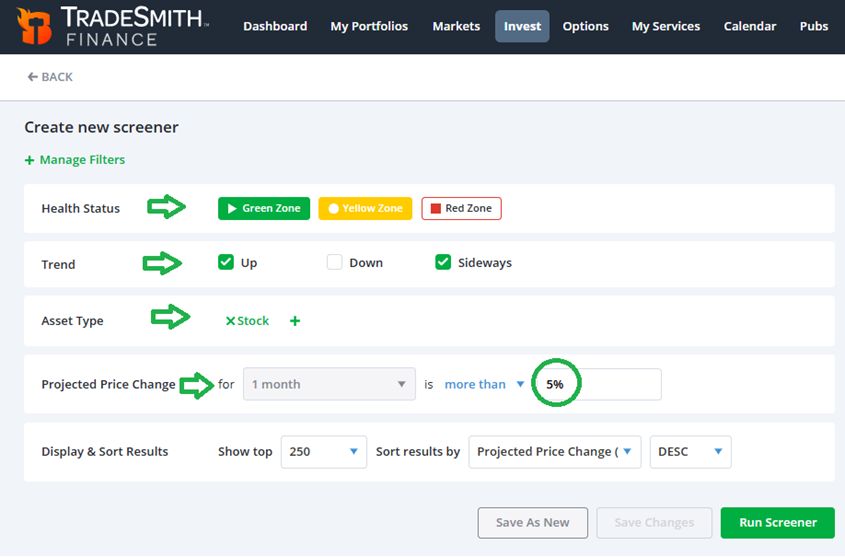
To set up this Predictive Alpha screener, be sure you’re signed in to your TradeSmith Finance account. Once you’re on your Dashboard,click on Invest in the top menu bar – then click on Screener, followed bythe green + Create new screener button.
This brings up the New Screener page, pre-populated with the basic TradeSmith filters. From the default options, you should select the following choices:
- Health Status: Click the colored icons to select Green Zone and Yellow Zone. (Leave Red Zone un-selected.)
- Trend: Check the boxes to select Up and Sideways.
- Asset Type: Click the green +Add option, then check the box for Stock.
You can click the gray trash can icon on the right of your screen to dismiss any other default filters – we won’t need them for this screener.
Next, we’ll add our exclusive Predictive Alpha filter, to find stocks likely to move higher in price over the next 21 trading days. To do this, click the green + Manage Filters option, and under the list of TradeSmith filters select Projected Price Change.
1 month is the default timeframe for this Predictive Alpha filter, which equals roughly 21 trading days. We know that if this current market correction is only temporary, then the S&P 500 should gain 5% or more over the next month – so be sure to set this filter to look for a change of more than 5%.
Once those advanced filters are in place, then under Display & Sort Results, sort by Projected Price Change (1m) and select DESC (descending).
This way, stocks with the highest one-month price projections according to Predictive Alpha will show up at the top of your list.
Finally, remember to click Save As New at the bottom of the page to save your work for next time.
Here’s a screenshot of what your Screener should look like when everything is set:
Keep in mind, you’ll need to be aPredictive Alpha or TradeSmith Platinum member to access the advanced Projected Price Change filter. If you don’t see the option (or the TradeSmith Screener tool) in your TradeSmith Finance dashboard — but would like to — call us at 888-623-0858 to discuss that.
Now you’re ready to Run Screener by clicking the green button. This screen will show you the top 250 stock results according to our Predictive Alpha system’s one-month projected price changes.
Due to space limitations, just the top 10 results (as of yesterday) are shown below:
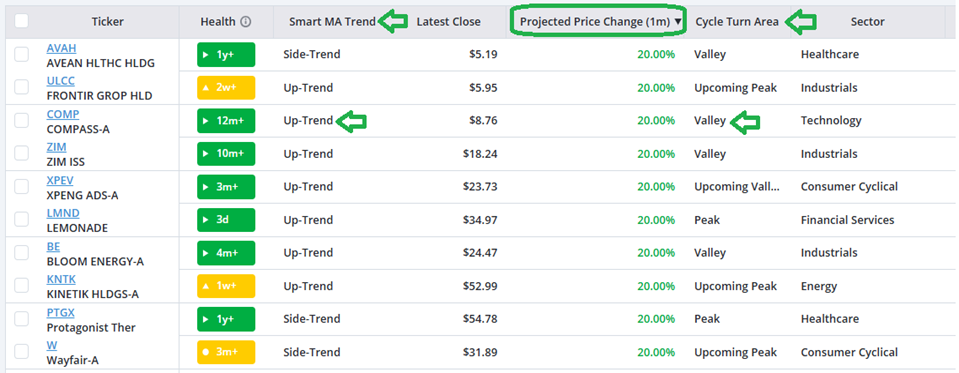
This list is already sorted by the column labeled Projected Price Change (1m) with the percentage price change listed for each stock.
And with so many potential results, you may want to add additional Screener filters to narrow your search results further.
One way to narrow the field is by focusing only on stocks that are still in our TradeSmith Smart Moving Average (MA) Up-Trend, despite the stock market’s current overall Down-Trend. You can do this by removing the Sideways selection from your Trend filter above. And if you have access to our powerful Seasonality tool, you may want to zero in on those stocks in a Valley or Upcoming Valley, according to our Trade Cycles data. Why not both? You can find them by adding the Cycle Turn Area filter.
Mike Burnick’s Bottom Line: Many years of market history suggest that stocks are likely to keep moving higher after this recent market correction. If so, then you should expect the S&P 500 and Nasdaq 100 Indexes to get back in gear to the upside soon… at least within the next month or so, hopefully.
And our AI-powered Predictive Alpha tools can help you make the most of the rebound, by finding those stocks that are projected to rise the most over the next month.
Good investing,
Mike Burnick
Senior Analyst, TradeSmith
P.S. The Predictive Alpha system is one of my favorite tools in the TradeSmith toolbox – and I’m always astonished by how far the AI-powered algorithms behind that tool have come in just a few years.
While our post-correction stock scanner offers a taste of how our proprietary market-scanning system can enhance your trading, it only scratches the surface: There’s much more to Predictive Alpha – and in today’s data-driven market environment, the system’s powerful market projections and keen analysis can help any investor or trader get a crucial edge on the market… whether you’re trying to profit off of a post-correction rebound or find key opportunities in a bull market.
It’s TradeSmith’s slice of the fast-developing AI revolution – and if you’d like to learn more, my friend and colleague Louis Navellier has plenty to say about our latest developments.
Louis has been a long-standing champion of AI and technology-assisted trading, especially in a post-ChatGPT world. And I can think of a few endorsements as strong as Louis’s dedication to Predictive Alpha’s cause.
He’s so enamored with our system, in fact, that he’s put together a video presentation highlighting the strengths of this AI-powered market master… where he shares just how effective Predictive Alpha can be when it comes to powering up your portfolio.