Overbought? Oversold? Here’s How to Profit Off Market Behavior
If you’re a buy-and-hold investor, you might not spend a significant amount of time worrying about technical indicators.
You set it. You forget it. And I get it.
But if you’re able to pay more attention on a daily or weekly basis, I want to show you how to generate a little more income from your extra positions and put more money directly into your pocket.
Use This Momentum Measurement
As you know, the market operates on human behavior.
Yes, we have fundamental analysis. We always want to think about which companies are improving their margins, boosting their return on equity, increasing dividends to attract investors, and fortifying their balance sheet.
But even the strongest fundamentals don’t reflect the true share price all the time. What I mean by this is that analysts may attempt to value a stock based on future cash flows, corporate growth estimates, or expected demand for new products or services. Different analysts have different price conclusions, and this is just one little piece of the puzzle for investors trying to navigate the landscape.
There is also basic investor sentiment. Sometimes people pile into a stock because the rest of the crowd does. Sometimes they sell because investors panic after a recent earnings report.
But when has the buying gone too far? When is a stock moving into what we call “overbought” conditions?
And when has the selling gone too far? When is it moving into “oversold” conditions?
To answer that question, we can turn to a very simple technical metric. Not only does it present opportunities for you to trade the stock in the short term, but also it can help you squeeze extra capital out of your existing long-term positions.
Let’s talk about the Relative Strength Index.
Buy Cheap, Sell Strong
If you want to know the sentiment of the market around a specific stock, there is no better technical tool to start with than the RSI, or relative strength index.
Created by J. Welles Wilder Jr. in 1978, the RSI measures recent price movements and the strength of a stock’s price trend. The metric moves between two price extremes on a range of 0 to 100. Investors can measure the RSI over any period of time that they wish. However, the industry standard among technical analysts is to focus on 14-day price movements. There’s no rhyme or reason for this default approach.
Typically, an RSI under 30 signals that a stock is oversold. When a stock falls to this level or below, a stock might be ready for a possible reversal. This means a buying opportunity may present itself for the short term.
Meanwhile, an RSI over 70 suggests that a stock is overbought. This suggests that a pullback might be coming.
Let’s take a look at one chart that provides some evidence of this type of action.
The stock listed below is Daseke (DSKE), a U.S.-based flatbed trucking company. The chart below offers a fine example of investor sentiment dating back to March.
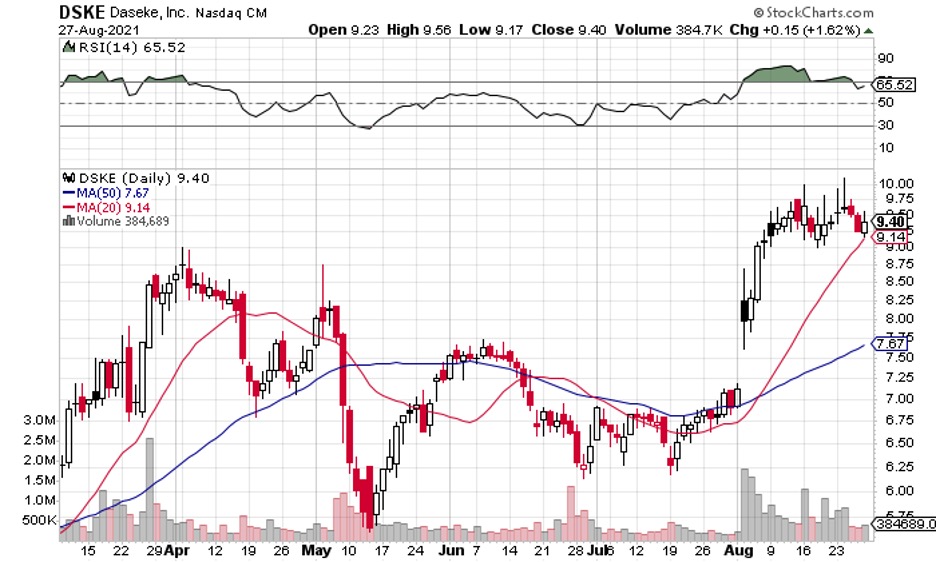
As you can see, in March, shares traded above an RSI of 70 for a few weeks, before a pullback occurred in the first two weeks of April. Shares dropped from more than $8.50 to roughly $7.00 over a period of 14 days. The RSI sitting above that psychological level appears to have predicted the ensuing pullback.
Then, look at the week of May 10. Shares collapsed to less than $6 after a heavy bout of selling among investors. In the RSI chart above the price chart, you can see that the RSI fell to less than 30.
And what happened next? Many traders saw a value and stepped in to purchase the stock. The RSI moved higher as buying picked up from mid-May to mid-June.
Now look at where the stock has been since early August.
In the beginning of the month, shares pushed above a 70 RSI and the price trend remained strong. After a prolonged period of the RSI being above that level, the stock is struggling to break above the $10 level.
It appears that a pullback could soon come on this stock.
How to Trade RSI with TradeSmith Finance
As you know, we pay very close attention to the price strength and the momentum of a stock on the TradeSmith Finance platform. We’re always focused on stocks trading in the Green Zone and sitting in uptrend momentum conditions.
In the event that you own 100 shares of a stock trading with these metrics and it happens to have an RSI above 70, this might be a good time to sell a covered call.
If you sell a call option on a stock you own, you can generate additional income on the underlying position at a time when conditions for this stock are overbought.
Let’s revisit Daseke.
The stock traded near $9.45 on Monday morning. Shares have rallied more than 32% over the last month. If this is a stock that you own and you’re following TradeSmith’s Health Indicator as your trailing stop, you’d know the Red Zone alert would currently be triggered at $3.39 given its sky-high VQ Score of 63.95%.
If you owned 100 shares of the stock while the RSI is above 70, you might sell a $10 call option for Nov. 19, 2021. The current contract is trading at $0.80 per share. For every 100 shares you own, you would sell someone the right, but not the obligation, to purchase your shares by the November expiration date should the stock surpass $10 per share.
This would put $80 in your pocket today. It also means that the upside of this trade is $10.80 per share. If the stock reaches that level, and you have to sell your stock at the $10 stock price by November, you would still generate a big gain from the covered call trade. That price target is roughly 14.3% higher than Monday’s price.
However, the goal of selling this covered call while the RSI sits at above 70 is to capitalize on the overbought conditions. With the RSI sitting at this level, we would expect a pullback to happen.
Therefore, the stock might fall back, and as a result the options contract would decline in value as well. The $0.80 call option that you sold today might pull back to $0.40 or less depending on how much the stock drops. If that is the case, you can buy the contract back at a lower price and pocket the difference.
Or… you can potentially wait and see if the contract expires below that strike price. If the contract expires worthless, you can just pocket a 100% gain on that contract and wait for another opportunity to sell a different contract.
Let’s talk tomorrow about what to do when the RSI is under 30 on a stock you own. This is a really interesting strategy, and it doesn’t require much to get started.