Is This the Return of the Lost Decade?
|
Listen to this post
|
The price action guides the narrative, and vice versa… Why Tesla’s big gain was too much, too fast… Where your tax dollars are going (it’s not good)… The “Lost Decade” thesis is still in play… These two sectors are quietly outperforming stocks… How to stay ahead of stagflation…
By Michael Salvatore, Editor, TradeSmith Daily
On Wednesday, April 24, we declared “History Says TSLA Is a Buy.”
This was after a bout of price action that ranks among the ugliest in the company’s history. The stock was down 44% from the start of 2024. It was down more than 60% from its all-time high.
It was also caught in the narrative equivalent of a 10-car pileup. Cybertrucks were being recalled by the thousands for faulty accelerator pedals. Chinese EV companies were eating into Tesla’s overseas business. The long-planned mass-market vehicle was reportedly canned.
Doubts swirled about the future of the company formerly hailed as part of the Magnificent 7…
And we faded the bearishness for one simple reason.
TSLA was down seven days in a row. That’s only happened a few times in TSLA’s history – and each time, on average, it had positive forward returns in the short- to mid-term.
Data, not narrative, drove our call that TSLA was a buy. And sure enough, TSLA’s quarterly report – despite missing on revenue and earnings – ignited a 10%-plus single-day rally once the market opened that day.
It didn’t stop there. From market close on Wednesday to the time I’m writing this, the stock is up an additional 21%. In other words, TSLA has achieved a historical two-month return after a seven-day down streak (over 31%) in about five trading days.
Also, miraculously, TSLA’s narrative problems seem to be resolving before our eyes. Tesla’s Full Self Driving technology is now approved in China. The “robotaxi” concept replaced the mass-market EV at the top of Tesla’s to-do list, and they’re planning to launch in August: much faster than many expected.
It’s a great example of the relationship between price action and narrative. Often, the two guide each other. Where before poor price action was making the lousy narrative grow louder, now the recovery is inspiring more hopeful headlines.
The question, of course, is whether it will last.
❖ We’re inclined toward caution on this one…
As impressive as TSLA’s recovery was, it has also thus far stuck to the technical script. Take a look at this chart below:
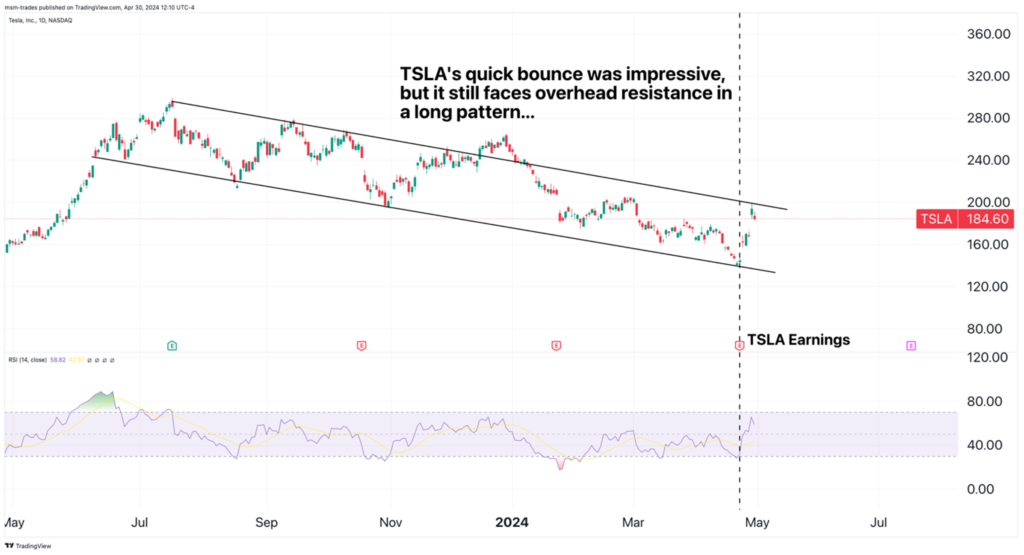
TSLA has been trading in a parallel downtrend channel for much of the past year, after falling from its 2023 high close to $300 per share.
But take a look at the Relative Strength Index (RSI) in the purple box below the price chart. Whenever the RSI drops to about 30, as it did in August, November, January, and now in April, that’s a signal the stock has gotten oversold. From there, the price tends to bounce off the bottom of the channel or consolidate for a few days.
Monday’s gains stopped just short of piercing the top of the channel. And the stock is now at its highest RSI level of 2024 – though still not in overbought territory.
As I write Tuesday, TSLA has pulled back a bit. I’ll want to see a clean close above the top downtrend line, and then a retest of that line as support, before saying with confidence that TSLA can resume its uptrend.
❖ Moving along, let’s return to the government debt situation…
On Monday, we took on the issue of U.S. government debt, noting its parabolic nature.
One underlying reason for that, which the Biden administration is attempting to solve with radical tax policies, is the cost of servicing that debt.
But as you might expect, higher taxes on a small percentage of Americans won’t be enough to fix the debt problem.
The chart below shows how newly dire the situation is, with that big uptick on the right side…
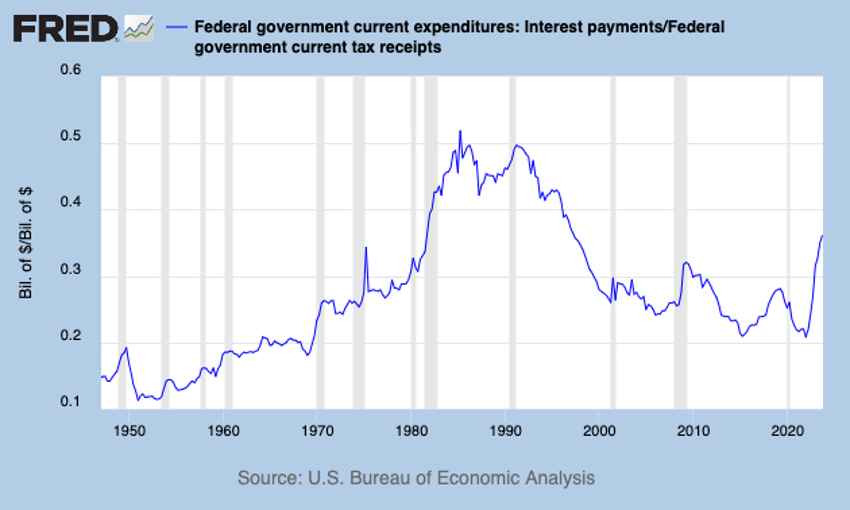
This chart shows the relationship between government income (tax receipts) and how much of that income the government spends solely on the interest payments for the debt.
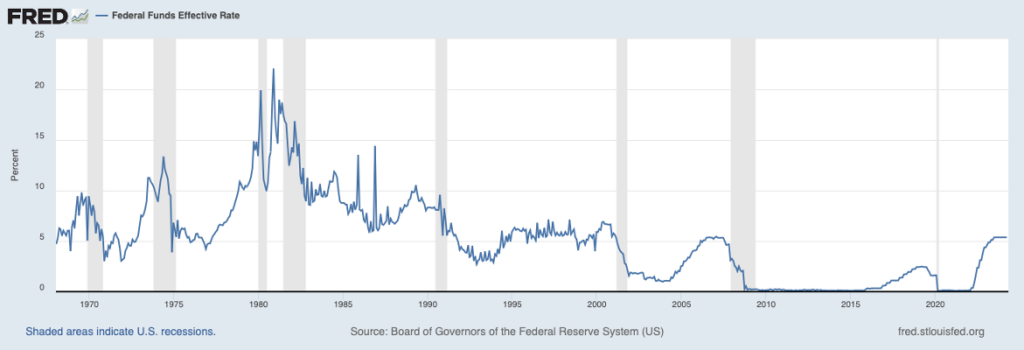
As you can see, more than a third of the income the government receives from taxes is now going toward servicing the debt. That’s the worst level since the years when Paul Volcker was the Fed chair and the federal funds rate hit 20% in December 1980. Here’s the long-term chart of the Fed’s key rate, for context:
Biden’s new tax agenda is estimated to bring in $2.2 trillion in revenue in the 11 years after they’re implemented, according to Tax Foundation. That’s not nothing, but it’s also just a bit more than the government’s current interest expense of about $1.3 trillion.
For this math to bear out, the government has to not spend anything more in the next 11 years to give the tax increases time to catch up. It also has to pay down the debt at a rate that exceeds the interest. The odds of either or both of these things happening are nowhere north of zero.
Bottom line: The government is in a difficult position, and that leads them to consider inflationary policies of spending to keep voters happy.
At the same time, as we discussed last week, the economy is finally starting to buckle under the weight of the Fed’s interest rate hikes.
But the ways to protect your wealth, in good times and bad, never change.
Hold great stocks in capital-efficient, dividend-paying companies for sure. But also hold real assets like real estate and gold, plus a bit of bitcoin to hedge against all this as well. In times like these, focusing on “inflation-resistant” assets is a good move.
❖ Especially since the word “stagflation” crept back into the headlines again this week…
Lower GDP and worsening inflation were the highlight of last week. And these two factors are the recipe for stagflation – a rare and unwelcome event where the erosion of purchasing power (inflation) is amplified by a poor or middling economic environment (stagnation). My colleague Justice Clark Litle, editor at TradeSmith Decoder, was among those sounding the call all the way back in October.
And most recently, in Monday’s Decoder, Justice said to watch for this narrative popping up in this afternoon’s Federal Reserve announcement:
“When the FOMC announces the latest policy decision on Wednesday of this week, it is highly likely they leave rates unchanged (no cuts or hikes).
“Investors will be listening closely to the after-meeting press conference, though, to try and get a sense of how much the recent inflation numbers have influenced Fed Chair Jerome Powell’s thinking — and the degree to which he is worried about stagflation.”
The last period of serious stagflation was in the 1970s. Often called a “Lost Decade,” we’ve wondered aloud if the 2020s could wind up looking similar.
Only time will settle the matter. But there are a few similarities we cannot ignore. Here are the factors we mentioned then, which you’ll notice are still very much in play:
- Energy prices are rising and volatile.
- Inflation is a big problem that’s not going away easily.
- Government spending is running hot to finance foreign military conflicts.
- Economic growth is weak or patchy.
- Interest rates are high and prone to rapid rises.
All of these things are even more true now than when we first wrote about them.
And here in 2024, even as the stock market has made a new high – defeating the go-nowhere market I warned about in November – it’s notable how different this year’s market is from last year’s.
For example – two assets have now outpaced the return of the stock market this year. You’d never guess what they are:
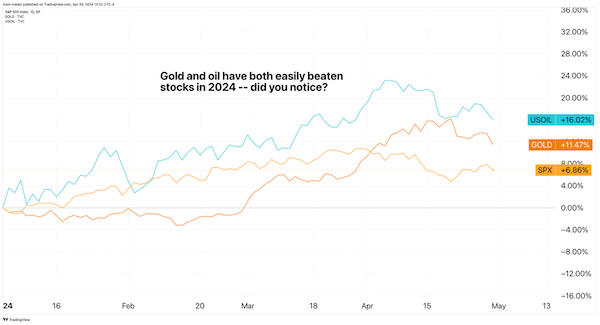
Crude oil and gold. The latter is close to double the return of stocks… and the former is doing even better.
Make no mistake, this is another sign of stagflation. Investors are highly preferring hard assets over stocks right now. We can see the same dynamic in play back in the 1970s:
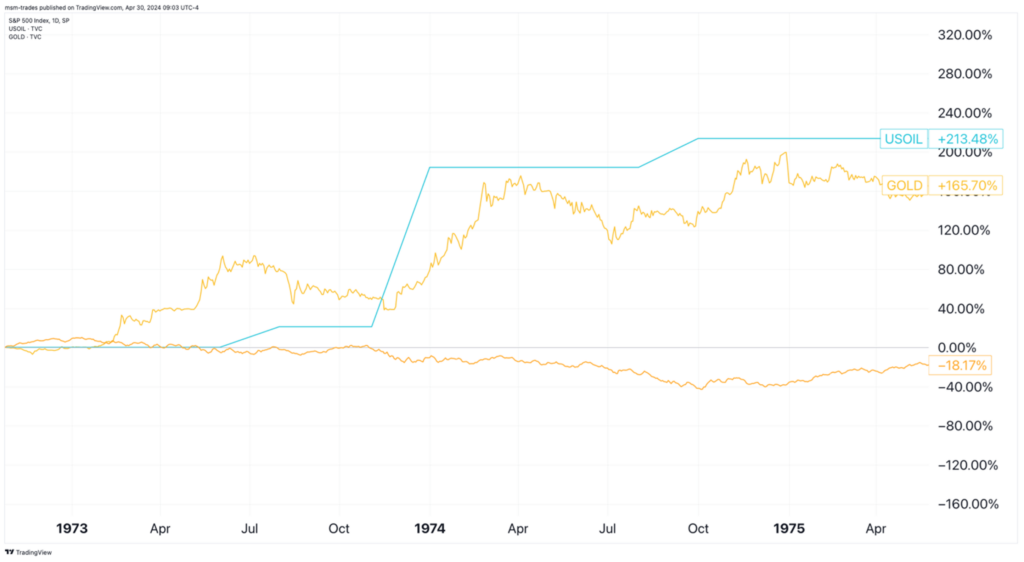
In the three years from 1973 to 1975, gold rose 166% and oil rose 213% as the stock market languished. During a time of high inflation and low growth, real assets won out.
Of course there were other factors at play, especially regarding oil.
But if such a thing were to happen today, it would put gold prices at over $6,000 an ounce and oil prices at over $250 a barrel. Both seem impossible… but then again, a lot of impossible-seeming things have happened over the past few years.
The bottom line here is you should find ways to hold exposure to these assets. Quality oil stocks (like we discussed Saturday) and gold miners are a good way to round out your portfolio.
And for another way to play quality oil stocks, tune in to TradeSmith Daily this Friday. For the income-inclined, we have something you’ll especially want to see.
To your health and wealth,
Michael Salvatore
Editor, TradeSmith Daily