The No. 1 Investment Factor I’m Focused on Today
Between surging inflation and stocks and bonds plunging in unison for the first time in decades, 2022 was incredibly challenging for most investors.
Unfortunately, 2023 could be shaping up to be even worse.
You see, the outlook for markets this year is arguably even hazier than it was this time last year.
On the one hand, we’re seeing some “green shoots” for the first time since the bear market.
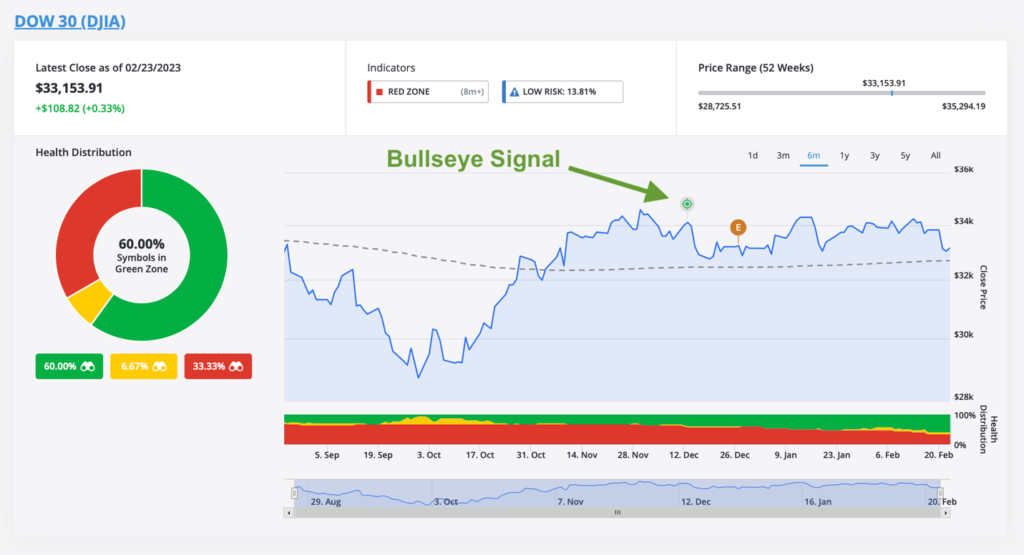
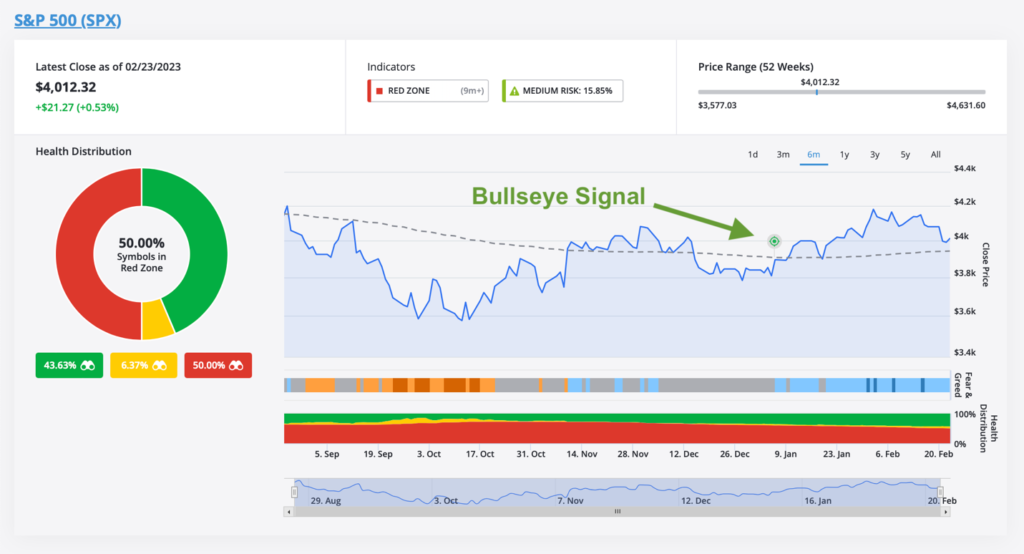
Inflation has been steadily easing for several months. Both stocks and bonds have been trending higher since last fall. And most notably, our proprietary TradeSmith Bullseye Signal has recently appeared in most of the major stock market indexes, including the three most widely followed indexes here in the U.S.
The Dow Jones Industrial Average (DJIA) was among the first to trigger this signal in mid-December.
The S&P 500 (SPX) joined it in early January.
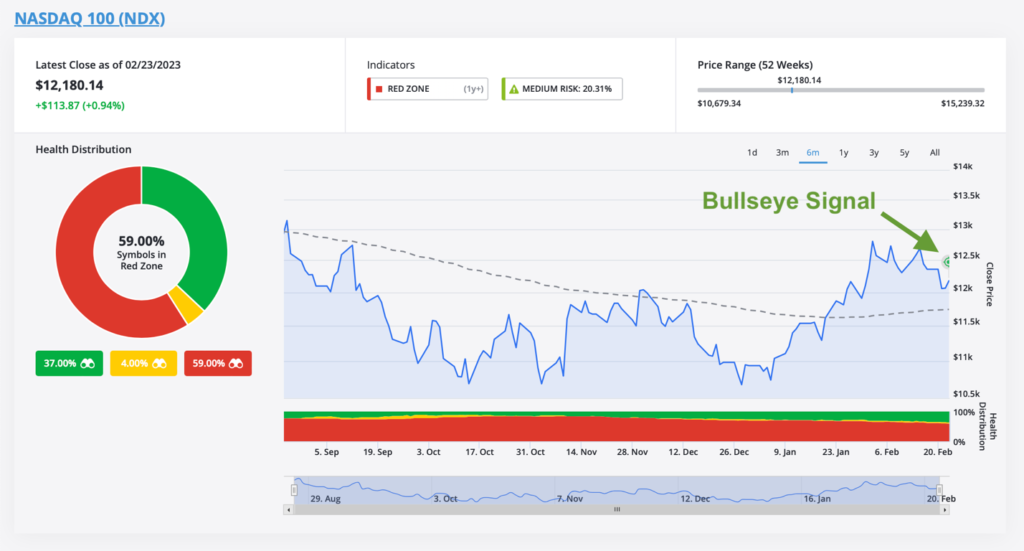
And the Nasdaq-100 (NDX) just triggered its own Bullseye on yesterday’s close.
If you aren’t familiar, the Bullseye Signal is the bullish counterpart to the Bearseye Signal I’ve mentioned before.
The Bullseye is meant to be an “early warning” signal that a new bull market could be starting. And while no indicator is perfect, like the Bearseye, the Bullseye has a pretty impressive track record.
Our backtesting shows it would’ve correctly “called the bottom” in stocks following every bear market and severe correction over the past 25-plus years, including the dot-com bust in May 2003 and the Great Financial Crisis in July 2009.
This signal also worked well in real time following the March 2020 crash. It triggered in several indexes beginning in late March and early April that year, while most investors were still bearish.
However, there are still reasons for caution as well.
The Federal Reserve continues raising interest rates. Several reliable metrics suggest the economy could be headed toward a recession. And the latest round of earnings reports we’ve seen this month suggests corporate profits are weakening significantly for the first time since late 2020.
Given these mixed messages, I believe investors would be wise to focus primarily on healthy, high-quality stocks in the healthiest areas of the market.
As longtime TradeSmith subscribers know, identifying the healthiest areas of the market is a cinch with our market health tools. As you can see in the snapshot of our S&P Sectors tool below, a handful of sectors are significantly healthier than the rest right now.
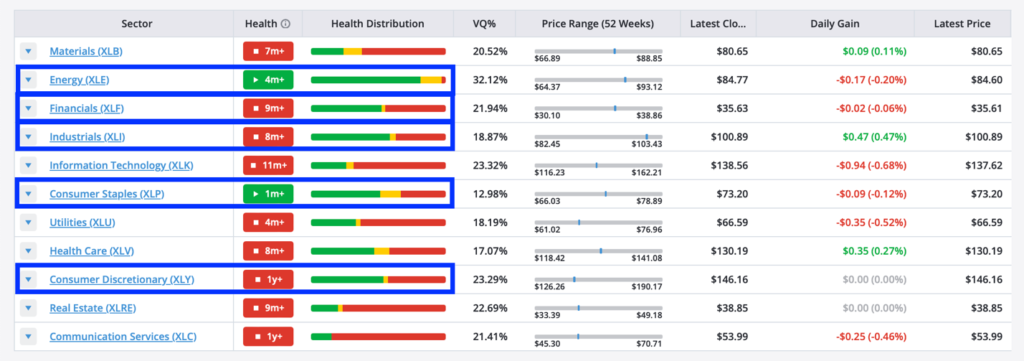
These include Energy (XLE), Consumer Staples (XLP), Financials (XLF), Industrials (XLI), and Consumer Discretionary (XLY). Only the first two are currently in the Health Indicator Green Zone, but all five are showing good relative strength, with more than 50% of their component stocks in the Green Zone today.
But how exactly do you identify high-quality stocks?
Well, this has typically required a fair bit of time and effort digging through a company’s fundamental data. And even then, not every individual investor necessarily has the skill set to do so easily.
But thanks to our brand-new TradeSmith Business Quality Score, I’m pleased to report finding quality stocks is now super simple, too.
This score ranks every company based on a composite of four broad quality metrics:
- Growth: This metric measures changes in a company’s metrics like sales, profit, return on equity (ROE), return on assets (ROA), and cash flow over the past five years.
- Profitability: This metric measures a company’s current level of profitability relative to its assets, sales, and shareholder equity.
- Safety: This metric measures a company’s financial strength (debt burden, credit risk, etc.) and its stock’s historical volatility versus the overall market.
- Payout: This metric measures how much of what a company earns benefits shareholders via dividends, net share buybacks, and debt repayment.
Our algorithms first calculate the current quality score for each stock compared to its history and all other stocks in our database. They then average those scores for each stock and rank them from the highest quality (100) to the lowest quality (0).
I’m thrilled to be able to offer this new feature, and I’m confident it will make our existing tools even more powerful.
Of course, I understand not every Money Talks reader is in a position to subscribe to our tools today. So, I wanted to share some of our system’s best quality-stock opportunities with you as well.
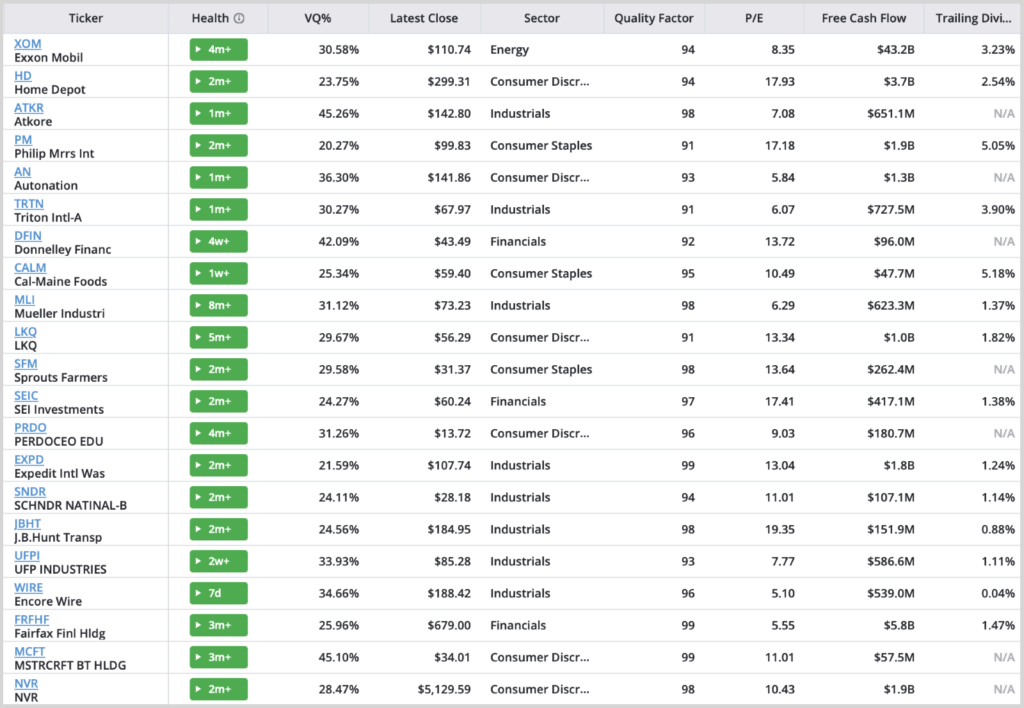
Specifically, I used our Screener tool to search for stocks that currently meet the following criteria:
- Healthy (in the Green Zone and in an uptrend)
- In a relatively healthy sector (Energy, Consumer Staples, Financials, Industrials, and Consumer Discretionary)
- Price-to-earnings (P/E) ratio of less than 20 (Significantly less expensive than the overall market)
- Positive free cash flow (FCF)
- And a Business Quality Score of 90 or above
I then ranked these results by the number of Ideas by TradeSmith strategies each qualifies for to come up with the top 20 high-quality stock opportunities today.
That’s it for this week. I’d love to hear what you think at [email protected]. As always, I can’t personally respond to every email I receive, but I read them all.