Three Fundamental Metrics Every Investor Should Consider Today
Earlier this year, I shared some simple guidelines for identifying “forever stocks.”
That’s my name for high-quality businesses that are likely to survive and thrive over the long run, regardless of what happens in the markets or the economy along the way.
These qualities make forever stocks fantastic long-term investments. However, they can also give you tremendous peace of mind during periods of market turmoil like we’ve experienced this year.
Given the risks of further “tough sledding” in stocks, I’d like to share a few more thoughts on this topic today. Specifically, I want to expand on a couple of those earlier guidelines – and share a new one – to help you identify the best, lowest-risk stocks to own right now.
Let’s get right to it, shall we?
Consistent Sales and Earnings Growth
One of the guidelines I mentioned in that earlier piece was related to growth: Forever stocks tend to generate consistent revenue (and earnings) growth.
While not every forever stock grows at a rapid clip, the highest-quality companies can generally increase sales and profits consistently over the long term.
This characteristic is always valuable, but I think it is critical if you’re considering new investments today.
The reason is simple: Given the growing risk of a significant economic slowdown in the coming months and quarters, I want to avoid companies already experiencing less-than-stellar performance.
An excellent way to access this characteristic is to look at a company’s recent sales (revenue) and earnings (net income) over the last one- and three-year periods.
Right now, I’d recommend sticking to companies that have shown at least some sales and earnings growth over both periods.
Double-digit percentage growth (10% or more) in one or more of these metrics is ideal. And I would avoid investing in companies that have experienced a significant decline in sales or earnings unless I had a good reason to do so.
TradeSmith Finance users can easily calculate these metrics using the company’s financial data.
Simply click the “Financials” tab on any company’s Position Card page and choose “Income Statement” from the dropdown menu to see its annual revenue and net income totals for the past four years.
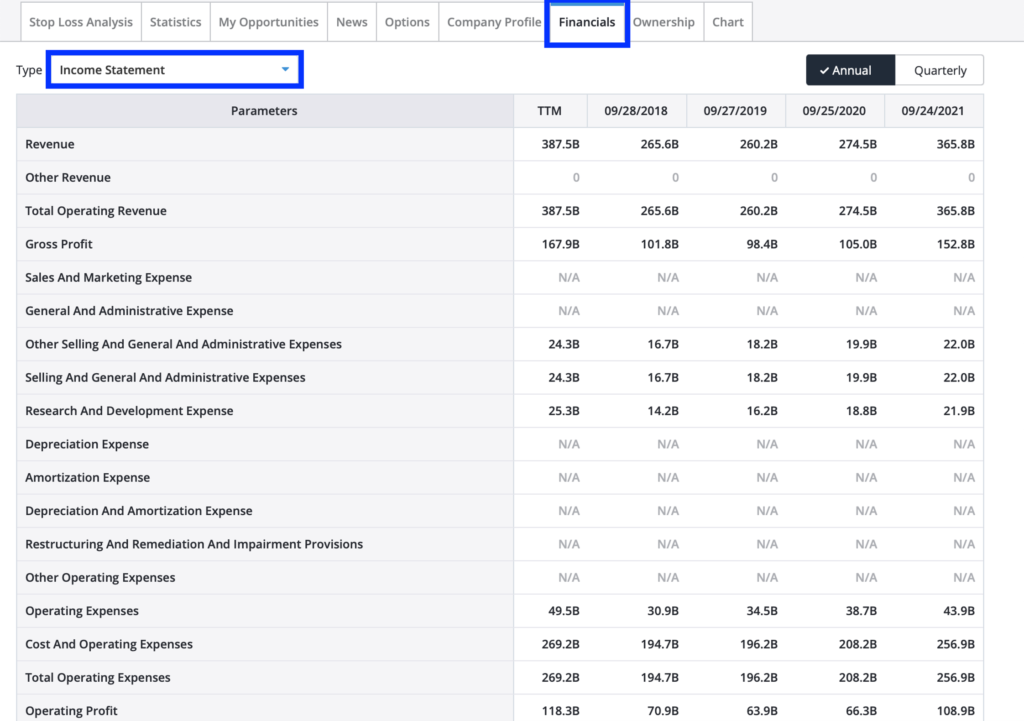
Readers who aren’t yet TradeSmith subscribers can also find this data through one of several free financial data websites, like Yahoo Finance.
To calculate these metrics, you’ll subtract the earlier year’s total revenue or net income from the current year’s value and then divide the remainder by the current year’s value.
For example, to calculate a company’s three-year sales growth, you would first subtract its 2018 annual revenue from its 2021 annual revenue. Then you would divide that result by the company’s 2021 annual revenue.
Profitability
The second characteristic I want to discuss is profitability.
As I explained earlier, high-quality companies tend to have relatively thick and consistent profit margins. These indicate that a business is skilled at allocating capital and controlling costs.
You see, not all growth is necessarily equal. Consistent profitability shows that a company can grow without having to overspend to do so.
Wide profit margins also allow a company to earn more money for every dollar of sales than its competitors, which makes the company generally better positioned to weather a tough economy.
Again, given the risks of economic trouble ahead, I recommend making this metric an even higher priority in your investing today.
Ideally, I would recommend sticking to companies with double-digit profit margins. And I would certainly avoid owning any companies that have not been profitable during this time, unless I had a good reason to make an exception.
Like before, this metric is easy to calculate using the same widely available data from a company’s income statement.
To do so, you’ll simply divide the company’s annual net income by its annual revenue.
I’d recommend calculating this for the company’s most recent year and the past few years to ensure its margins have remained relatively consistent.
Debt to Equity
Finally, I want to mention one additional metric I didn’t include previously. That is debt, or more specifically, the total debt-to-equity ratio.
This ratio compares what percentage of a company’s assets has been financed by borrowing (debt) versus what percentage has been funded directly by its owners (shareholder investment and retained earnings).
In simple terms, this metric tells us how dependent a company is on debt to run its business. It can also give us a rough estimate of the affordability of its debts, as well as how easily the business could borrow additional money in the future if necessary.
A good debt-to-equity ratio indicates that a company can operate and grow its business without having to borrow a lot of money.
That can be a fantastic quality in any market environment. However, with interest rates moving significantly higher this year, I think it’s more important than ever to focus on companies that use debt responsibly.
With debt-to-equity, lower is typically better. So, I would generally recommend avoiding companies with debt-to-equity ratios of more than 25% (.25) today. (There are some high-quality companies in specific industries like real estate that successfully manage higher debt levels, but this is still a good rule of thumb.)
Again, you can find the data necessary to calculate this under a stock’s “Financials” tab in TradeSmith Finance and on other free financial data sites. Only this time, you’ll use a company’s balance sheet rather than its income statement.
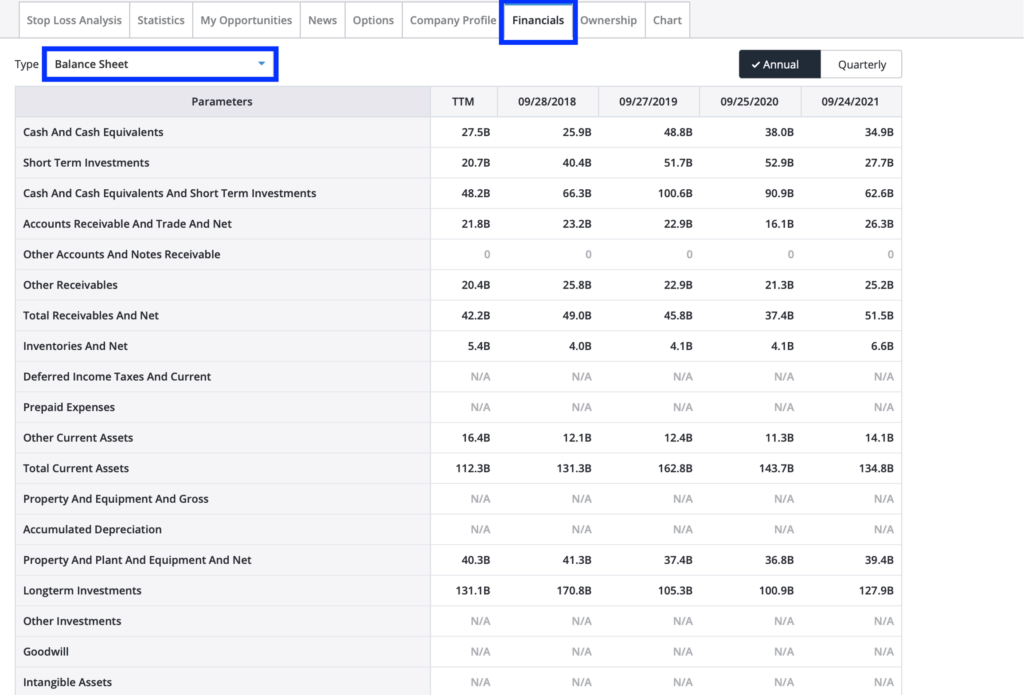
To do so, you’ll divide a company’s total debt (which includes short-term debt, long-term debt, and any other fixed payments) by its total shareholder (or stockholder) equity.
That’s all there is to it.
As you can see, these fundamental metrics are relatively simple. But when used alongside those I shared previously, these measures can dramatically reduce your risk when investing in stocks in volatile markets like we’re experiencing today.