Listen to the audio version of this article (generated by AI).
Last week, the staff at a Denny’s on Berryessa Road in San Jose took a plaque off the wall beside a corner booth.
It read: “The booth that launched a $1 trillion company. Congrats NVIDIA! Who knew that an idea started here would change the world?”
A day later, Denny’s said it was putting the plaque back up.
That booth is where Jensen Huang and two fellow engineers met in 1993, over Denny’s breakfasts and a lot of coffee, to plan a company that would make 3D graphics chips.
Huang ran Nvidia (NVDA) for the next 33 years, turning it into the world’s most important chipmaker and the first company ever to reach a valuation of $5 trillion. That made him one of the most powerful figures in the AI boom.
Last Thursday, the company announced he had resigned, effective immediately. His board had opened an investigation into his conduct over an affair with an alleged Chinese spy.
NVDA plunged 14% that morning.
This Tuesday, Nvidia reported $115.8 billion in quarterly revenue – more than double last year’s haul and about $7 billion more than Wall Street expected. Even so, the stock closed Tuesday about 36% below its October high. As of yesterday’s close, it was in a 40% drawdown.
How can a company that’s blowing the doors off earnings be falling so hard?
Nvidia shareholders are in the same bind Denny’s was in. They love the company but are rattled by the headlines and unsure what to do next.
I’ve watched investors face that moment many times with Nvidia and plenty of other high-flying stocks. Some hold on and are glad they did. Plenty sell near the bottom and spend years wishing they hadn’t.
Buy-and-hold is easy on a calm day. It’s a lot harder when your favorite stock has gapped down 14% before lunch.
Today, I’ll show you why headlines make even the best stocks so hard to hold… and how a different approach I outlined in Wednesday’s online event lets you tell the news to take a hike and trade the stocks’ own data instead.
Uncomfortable Ride
Nvidia has been one of the greatest stocks of our lifetime. Even after this month’s slide, it’s up about 6,100% over the past 10 years. That’s enough to turn every $1,000 invested into about $62,000.
But owning it has never been a comfortable ride. Figures from research firm Trefis show what holders have sat through:
- 2008 to 2009: down 84% during the financial crisis.
- Late 2018: down 56% as a trade war with China heated up and the Fed kept raising rates.
- 2022: down 63% as inflation hit a 40-year high and the Fed raised rates at its fastest pace in decades.
- 2025: down 32% in the tariff sell-off.
Now there’s this month’s plunge, with its cofounder and CEO walking out the door.
What most of those drops had in common was a story that made selling feel like the sensible thing to do. A falling price is unnerving on its own. Add a headline about why it’s falling, and selling stops feeling like panic and starts feeling like prudence.
Usually, the fear fades and the stock recovers. Nvidia climbed out of every one of those holes to reach new highs. Some of those recoveries took months. The recovery from the 2008 crash took about eight years.
I’m not saying folks holding Nvidia now are in for the same fate.
But if you’re close to retirement and Nvidia accounts for a big chunk of your nest egg, you may not be able to wait even half that long. And if you’re one of the investors who sold on the headline, you won’t share in the recovery at all.
One of the costliest mistakes an investor can make is letting emotions make the decisions. Headlines are built to trigger those emotions, and these days they come at us around the clock.
That’s why we built our Signals trading system to work without the headlines.
Tell the News to Take a Hike
Every morning, our system scans 2,467 stocks for “signals.” These are rare alignments of factors in a stock’s own trading data that, over the past 10 years, have come before a move up or down. The system doesn’t read the news. It watches how a stock actually behaves.
We didn’t discover these signals on our own. There’s way too much data for a human to trawl through looking for these tells. We trained an AI model on signals we’d already collected and asked it to look for more hiding in the trading data of thousands of stocks.
Every stock has its own personality. A software company reacts to a recession differently than a retailer. When oil prices fall, oil producers suffer while airlines celebrate, because fuel is one of their biggest costs. Over 10 years, a stock lives through thousands of headlines, including earnings reports, rate hikes, and crashes. Each one leaves a trace in how it trades.
Our system studies those traces until it has what I call a behavioral profile of the stock. It’s a bit like the way your doctor knows your normal blood pressure. A reading that would alarm a stranger may be perfectly ordinary for you, and the reverse is also true.
So when bad news hits, the system doesn’t need to read the headline. It already knows how this particular stock has tended to behave when it’s been beaten down and frightened before… and whether that has usually been a moment to step aside or to step in.
One of my investing heroes, the late Jim Simons, built the most successful hedge fund in history on the same idea. His firm, Renaissance Technologies, famously didn’t need to know why a particular signal worked. If the gains held up, the signal stayed. If they faded, it was dropped.
That’s why the data sometimes disagrees with the news, and it can disagree in either direction. Two examples I gave at our Signals event on Wednesday were Kenvue (KVUE), the company behind Tylenol and Listerine, and Walmart (WMT).
On May 28, 2025, Kenvue had just announced a five-year partnership with Microsoft to expand its use of AI. On the face of it, that was good news. But our system flagged a bearish signal, a sign the stock was likely to fall, and that signal had been right 91% of the time. Over the following days, Kenvue fell 9%.
It works the other way, too. One of Walmart’s signals has fired just 24 times in 10 years, and the stock rose afterward 92% of the time. It worked in 2017, too, right after one of Walmart’s worst earnings reports in a decade.
That brings us back to Nvidia.
This Signal Fires When Fear Is Running High
One of Nvidia’s signals has appeared 38 times in the past decade, and the stock rose after 36 of them.
It worked during the 2020 chaos. It worked in 2022, delivering a 12.4% gain in eight days while the market was falling. It worked three times in 2025, tariff crash and all. Buy-and-hold investors were sitting through those same crashes.
And this morning, with the headlines still ugly, our system flagged a bullish signal on Nvidia. It fires when the stock has closed lower four or more days in a row while the VIX, Wall Street’s “fear gauge,” is running above its 10-day average.
In other words, it fires when both the stock and the market are rattled. It has done that 48 times in 10 years and been right about 83% of the time, with a median hold of eight and a half days.
But what really caught my eye was its recent win rate. It’s fired six times this year. And every setup has been a winner, for an average gain of 8.1%.
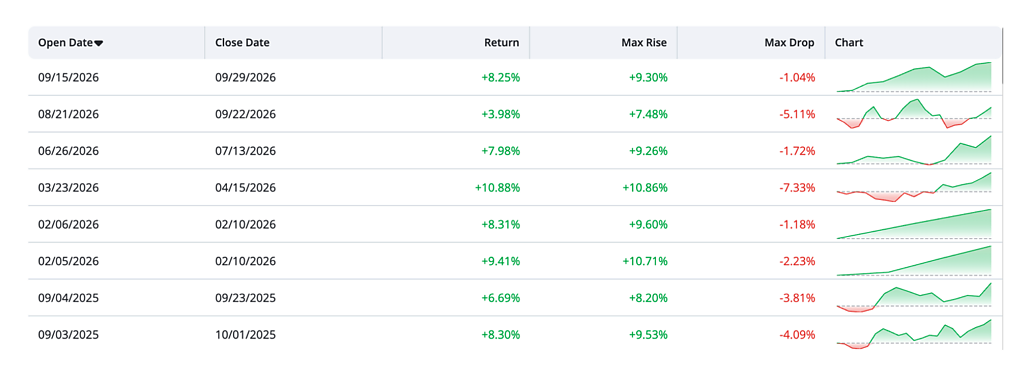
I’m not recommending you buy Nvidia here. By the time you read this, that trade is already underway. I’m showing you the kind of historical detail Signals unearths for each trade.
Every trade comes with its exit set before you buy, a profit target and a time limit, so you’re never left deciding what to do in the middle of a frightening headline.
This Bullish Window Is Closing
Buy-and-hold can be hard work in times like this. But that doesn’t mean you should give up on long-term investing altogether. It’s hard to find a better way to build wealth than holding stocks for the long run.
I’m still bullish on U.S. stocks over the long run, and selling everything today could be like selling in 1998, more than a year before the dot-com boom peaked.
But don’t expect a smooth ride. Our seasonality research shows the S&P 500 has risen during the run-up to Thanksgiving in 14 of the past 15 years. That window closes in early December, and with it goes the market’s seasonal tailwind. I expect volatility to stay high into 2027.
In a market like that, relying on buy-and-hold alone means facing the hold-or-sell decision again and again, at the worst possible moments, with the news at its scariest.
A shorter-term strategy works differently. You hold for days or weeks, you know your exit before you buy, and you don’t need the market to go up, because our system hunts for bearish signals as well as bullish ones.
The headlines will keep coming. With the right approach, you don’t have to let them make your decisions for you.
I showed how it works on Wednesday and why it matters so much in the volatile seasonal period ahead. If you missed it, watch the replay here.
All the best,
Keith Kaplan
CEO, TradeSmith